About the Phoenix 5 Indicator
The Phoenix 5 Indicator for MT5 is a trend reversal tool that identifies potential bullish and bearish reversals across any timeframe.
It uses market data analysis to generate signals as colored dots directly on the price chart.
Blue dots indicate potential bullish reversals, signaling opportunities to enter long trades.
Magenta dots indicate potential bearish reversals, signaling opportunities for short trades.
The indicator can function as a standalone tool, providing clear signals without the need for additional technical indicators.
All inputs are fully customizable, including SMA period, percent, envelope period, OsMA fast and slow, OsMA signal, and fast price.
Phoenix 5 works on all timeframes and any instrument available on MT5, including Forex pairs, commodities, indices, and stocks.
Free Download
Key Features
- Detects bullish (blue) and bearish (magenta) trend reversals.
- Standalone indicator requiring no additional tools.
- Customizable SMA, percent, envelope, and OsMA parameters.
- Works on all timeframes and trading instruments.
- Provides clear visual entry signals with colored dots.
- Helps define stop loss and take profit levels based on recent support and resistance.
Indicator Chart
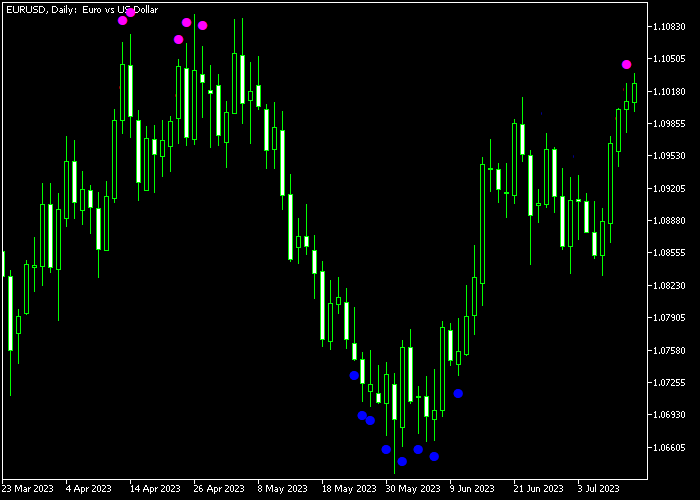
The Phoenix 5 Indicator plots blue and magenta dots directly on the main price window.
Blue dots appear at potential bullish reversal points, while magenta dots appear at potential bearish reversal points.
Traders monitor these dots in combination with price action to determine high-probability entry and exit points.
Guide to Trade with Phoenix 5 Indicator
Buy Rules
- Wait for a blue Phoenix 5 dot to appear on the chart.
- Confirm upward momentum or support levels for the trade.
- Enter a buy market order after the dot forms.
- Trade in line with short-term bullish signals and recent support.
Sell Rules
- Wait for a magenta Phoenix 5 dot to appear on the chart.
- Confirm downward momentum or resistance levels for the trade.
- Enter a sell market order after the dot forms.
- Trade in line with short-term bearish signals and recent resistance.
Stop Loss
- Place the stop loss just below immediate support for buy trades.
- Place the stop loss just above immediate resistance for sell trades.
- Position stops just beyond recent support or resistance levels for better trade protection.
Take Profit
- Exit buy trades at a fixed profit target or when a magenta dot appears.
- Exit sell trades at a fixed profit target or when a blue dot appears.
- Optionally, trail profits using dynamic support and resistance levels.
Phoenix 5 and Half Trend Alert Reversal Strategy for MT5
This trend reversal strategy combines pattern‑based reversal signals with trend direction confirmation.
It uses the Phoenix 5 Forex Indicator for MT5 to spot potential reversal points with colored dots, while the Half Trend Alert Indicator MT5 confirms trend direction with arrows.
By focusing on reversal signals that match the confirmed trend shift, this method helps reduce false entries and targets stronger moves when market momentum changes.
Keeping entries structured with trend confirmation helps traders avoid choppy price action and focus on high‑probability reversals.
Buy Entry Rules
- Wait for a blue arrow from the Half Trend Alert Indicator indicating a potential shift toward a bullish trend.
- Confirm a reversal with a blue Phoenix 5 dot appearing at or near a market swing low.
- Enter a buy trade at the opening of the next candle after the Phoenix 5 dot appears.
- Place a stop loss just below the swing low created by the reversal signal.
- Take profit at the next resistance level or when a red Phoenix 5 dot appears.
Sell Entry Rules
- Wait for a red arrow from the Half Trend Alert Indicator indicating a potential shift toward a bearish trend.
- Confirm a reversal with a magenta Phoenix 5 dot appearing at or near a market swing high.
- Enter a sell trade at the opening of the next candle after the Phoenix 5 dot appears.
- Place a stop loss just above the swing high created by the reversal signal.
- Take profit at the next support level or when a blue Phoenix 5 dot appears.
Case Study 1
On EURUSD H1, price was trending downward before showing signs of a potential reversal.
The Half Trend Alert Indicator printed a blue arrow signaling a developing bullish shift.
Shortly afterward, a blue Phoenix 5 dot formed near a prior swing low.
A buy trade was entered at the next candle open with the stop loss placed just below the reversal low.
Price continued upward with strong momentum and reached a nearby resistance level, where the trade was closed for a 47 pip profit as market momentum peaked.
Case Study 2
On GOLD M15, the market had been rising before momentum slowed.
The Half Trend Alert Indicator printed a red arrow signaling a developing bearish shift.
A magenta Phoenix 5 dot then appeared near a recent swing high.
A sell trade was opened at the next candle open with a stop loss above the reversal high.
Price moved lower with sustained bearish pressure and hit the next key support.
The position was closed for a small loss when the Gold price stalled near support.
Download Now
FAQ
Can Phoenix 5 be used on any timeframe?
Yes. The indicator works across all timeframes, from M1 to daily charts.
Should I use other indicators with Phoenix 5?
It can be used standalone, but some traders combine it with trend indicators or support/resistance levels for additional confirmation.
Can the dot colors be customized?
Yes. You can set your preferred colors for bullish (blue) and bearish (magenta) dots for better chart visibility.
Summary
The Phoenix 5 Indicator identifies potential trend reversals using clear blue and magenta dot signals.
It provides actionable entries, stop loss placement, and exit strategies for both intraday and swing trades.
As a standalone indicator, it simplifies decision-making and improves trend reversal detection.
For traders looking for precise reversal signals across all instruments and timeframes, Phoenix 5 delivers a reliable and customizable solution.