About the Ichimoku Cloud Indicator
The Ichimoku Cloud Indicator for MT5 converts the traditional Ichimoku indicator into a simplified color-based trend tool.
Instead of displaying multiple lines, it blends Tenkan-sen, Kijun-sen, and Senkou Span calculations into a dynamic cloud that reacts directly to price momentum.
When the cloud turns green, the market shows bullish strength. When it shifts to purple, bearish pressure takes control.
This transformation allows traders to read trend direction instantly and focus on execution.
Traders can use it as a standalone trend-following system or combine it with price-action confirmation for higher-probability setups.
Free Download
ichimoku_cloud.mq5 Indicator (MT5)
Key Features
- Transforms classic Ichimoku calculations into a color-based cloud.
- Green cloud signals bullish market conditions.
- Purple cloud signals bearish market conditions.
- Customizable Tenkan-sen, Kijun-sen, and Senkou Span parameters.
- Works on all timeframes and major trading instruments.
- Helps identify trend reversals and continuation phases.
Indicator Chart
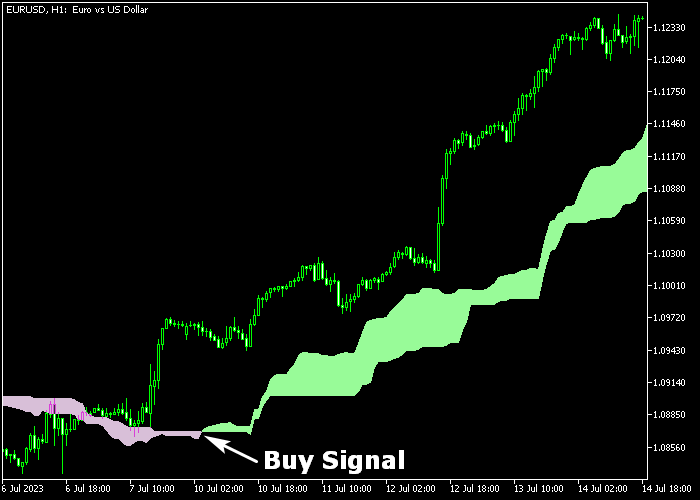
The Ichimoku Cloud Indicator is plotted directly in the main price window, forming a colored cloud around price action.
A green cloud reflects upward momentum and potential buy setups. A purple cloud reflects downward pressure and potential sell opportunities.
The shift between colors often signals the beginning of a new directional move.

Guide to Trade with Ichimoku Cloud Indicator
-
Buy Rules
- Wait for the cloud to change from purple to green.
- Confirm that the candle closes above the green cloud.
- Enter a buy position at the close of the bullish confirmation candle.
-
Sell Rules
- Wait for the cloud to change from green to purple.
- Confirm that the candle closes below the purple cloud.
- Enter a sell position at the close of the bearish confirmation candle.
-
Stop Loss
- Place the stop loss below the green cloud for buy trades.
- Place the stop loss above the purple cloud for sell trades.
-
Take Profit
- Close buy trades when the cloud turns from green to purple.
- Close sell trades when the cloud turns from purple to green.
- Alternatively, target a fixed risk to reward ratio such as 1:2 or 1:3.
- Advanced traders may partially close positions near key levels.
Ichimoku Cloud Breakout Strategy for MT5
This breakout strategy combines the Ichimoku Cloud Indicator for MT5 with the Super Trend Line Channel Indicator for MT5 to capture strong price expansions after consolidation.
It focuses on trading confirmed breakouts in the direction of the prevailing trend.
The Ichimoku Cloud defines the overall market bias. A green cloud signals bullish conditions, while a purple cloud indicates bearish pressure.
The cloud also acts as dynamic support and resistance, helping traders understand where breakouts are more likely to succeed.
The Super Trend Line Channel identifies breakout points.
When price breaks and closes above the orange channel line, it signals bullish expansion.
When price breaks and closes below the red support channel line, it signals bearish continuation.
Since the channel is based on volatility and trend structure, it helps filter false breakouts and highlight strong moves.
This strategy works best on M5, M15, and H1 timeframes.
It is ideal for traders who want to catch explosive intraday or short-term moves after consolidation phases.
Buy Entry Rules
- Confirm that the Ichimoku Cloud is green, indicating a bullish market environment.
- Wait for the candle to break and close above the orange channel line.
- Enter a buy trade at the opening of the next candle after the breakout.
- Place the stop loss below the broken channel line or below the nearest support level.
- Take profit when price shows rejection at resistance or when momentum slows, or close if price falls back inside the channel.
Sell Entry Rules
- Confirm that the Ichimoku Cloud is purple, indicating bearish conditions.
- Wait for the candle to break and close below the red support channel line.
- Enter a sell trade at the next candle open after confirmation.
- Place the stop loss above the broken channel or above the nearest resistance level.
- Take profit when price approaches support or when momentum weakens, or close if price returns inside the channel.
Case Study 1: EURJPY M15 Breakout Buy
On EURJPY M15, the Ichimoku Cloud turned green, confirming a bullish trend.
Price consolidated just below the channel resistance before breaking strongly above the orange line with a full candle close.
A buy trade was entered at the next candle open. Price accelerated quickly as breakout momentum increased.
The trade was closed near a resistance zone for 47 pips after a strong upward move, capturing a clean breakout continuation.
Case Study 2: AUDJPY M5 Breakout Sell
On AUDJPY M5, the Ichimoku Cloud was purple, indicating bearish conditions.
Price moved sideways before breaking below the red support channel line with a decisive candle close.
A sell position was opened immediately after confirmation. Price dropped sharply as sellers took control.
The trade was closed as price approached a support level, securing a fast breakout profit.
Download Now
ichimoku_cloud.mq5 Indicator (MT5)
FAQ
Is the Ichimoku Cloud Indicator beginner friendly?
Yes. The color-based cloud simplifies traditional Ichimoku interpretation.
Traders focus on cloud color and price position without analyzing multiple lines.
Can I adjust the Ichimoku parameters?
Yes. You can modify Tenkan-sen, Kijun-sen, and Senkou Span settings to match specific instruments or trading preferences.
Default values remain effective in most market conditions.
Does the cloud repaint after a signal forms?
The cloud updates according to live price data. Once a candle closes and confirms the color change, the signal remains fixed.
Summary
The Ichimoku Cloud Indicator simplifies trend trading by converting traditional Ichimoku calculations into a direct color-based system.
Green clouds support bullish strategies. Purple clouds favor bearish setups.
This approach helps traders react quickly to momentum shifts while maintaining disciplined risk control.
It adapts well to multiple markets and trading styles.
For traders who prefer straightforward trend identification and defined entry logic, this indicator offers a practical and efficient solution.


