
About the Super Trend Line Channel Indicator
The Super Trend Line Channel Indicator for MT5 automatically plots a dynamic trend line channel based on your selected time frame.
It analyzes recent price swings and builds an upper and lower boundary that adapts to current market conditions.
When price breaks and closes outside the channel, the indicator highlights potential breakout opportunities.
A candle close above the orange channel signals bullish strength. A candle close below the red channel signals bearish pressure.
The channel adjusts in real time, helping traders react to momentum shifts without delay.
You can modify inputs such as period, limit, and channel colors to match your strategy.
Free Download
trendlinesday.mq5 Indicator (MT5)
Key Features
- Automatically plots a dynamic trend line channel.
- Buy signal on candle close above the orange channel.
- Sell signal on candle close below the red channel.
- Customizable period and limit settings.
- Adjustable channel colors for personalization.
- Suitable for all MT5 time frames.
Indicator Chart
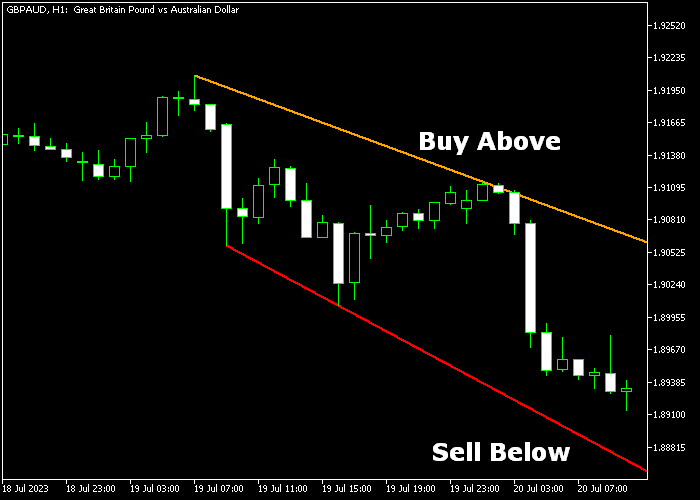
The indicator appears directly on the main price chart as two colored channel boundaries.
The orange upper line marks bullish breakout levels, while the red lower line defines bearish breakout zones.
Traders watch for strong candle closes beyond these levels to confirm entry signals.
Guide to Trade with Super Trend Line Channel Indicator
Buy Rules
- Enter a buy trade when a candle closes above the orange channel line.
- Wait for a strong bullish close to confirm breakout strength.
- Avoid entries if price immediately returns inside the channel.
- Check higher time frame direction for additional confirmation.
Sell Rules
- Enter a sell trade when a candle closes below the red channel line.
- Confirm that the breakout candle shows strong bearish momentum.
- Avoid entries if price quickly moves back inside the channel.
- Align the trade with the broader trend when possible.
Stop Loss
- For buy trades, place the stop loss below the red channel line.
- For sell trades, place the stop loss above the orange channel line.
- You may also use the most recent swing high or low.
- Trail the stop along the channel as the trade develops.
Take Profits
- Target a minimum risk-to-reward ratio of 1.5 to 1.
- For buy trades, aim for the next major resistance level.
- For sell trades, aim for the next major support level.
Super Trend Line Channel MT5 and Breakout Indicator Forex Strategy
This breakout strategy focuses on capturing strong momentum moves when price escapes key levels.
It combines the Super Trend Line Channel Indicator for MT5 with the Breakout Indicator for MT5.
The approach is built around confirmation. First, identify directional bias through trendline breaks. Then enter when a breakout is confirmed.
The Super Trend Line Channel defines structure using dynamic trendlines.
A candle close above the orange trendline signals bullish strength. A candle close below the red trendline signals bearish pressure.
The Breakout Indicator highlights consolidation zones with upper and lower red lines.
When the candle closes beyond these levels, it confirms a breakout and often signals the start of strong momentum.
Breakouts typically mark the beginning of new trends or sharp price moves, especially when price closes beyond key levels.
This strategy works best on M5 and M15 timeframes.
It suits day traders who want to trade explosive moves with clear confirmation and avoid false entries.
Buy Entry Rules
- Wait for a candle to close above the orange trendline on the Super Trend Line Channel.
- Confirm bullish bias is active.
- Wait for a candle to close above the upper red line of the Breakout Indicator.
- Enter a buy trade immediately after the breakout candle closes.
- Place the stop loss below the breakout zone or recent swing low.
- Set take profit at the next resistance level or close the trade if price falls back below the breakout level.
Sell Entry Rules
- Wait for a candle to close below the red trendline on the Super Trend Line Channel.
- Confirm bearish bias is active.
- Wait for a candle to close below the lower red line of the Breakout Indicator.
- Enter a sell trade immediately after the breakout candle closes.
- Place the stop loss above the breakout zone or recent swing high.
- Set take profit at the next support level or close the trade if price moves back above the breakout level.
Case Study 1: Bullish Breakout on EUR/USD
On the M15 timeframe, EUR/USD showed a candle closing above the orange trendline on the Super Trend Line Channel, signaling bullish strength.
Shortly after, price consolidated near the breakout zone.
A strong bullish candle then closed above the upper red line of the Breakout Indicator.
A buy trade was entered immediately after the breakout confirmation.
Price accelerated upward with momentum. The trade was closed near a resistance level, capturing a clean breakout move.
Case Study 2: Bearish Breakout on GBP/USD
During a London session on M5, GBP/USD closed below the red trendline on the Super Trend Line Channel, confirming a bearish bias.
Price moved sideways briefly before breaking lower.
A bearish candle closed below the lower red line of the Breakout Indicator. A sell trade was entered after the breakout.
The stop loss was placed above the recent range. Price dropped quickly with strong momentum.
The position was closed near a support zone, locking in a fast intraday profit.
Download Now
trendlinesday.mq5 Indicator (MT5)
FAQ
Does the channel repaint after the breakout?
The channel adjusts as new price data forms, but breakout signals are based on candle closes. This helps maintain consistency once a candle has completed.
Can I use this indicator for ranging markets?
The indicator performs best during trending or expanding volatility conditions. In tight ranges, false breakouts may occur more frequently.
Is it suitable for intraday trading?
Yes. It works well on lower time frames for intraday breakout strategies and on higher time frames for swing trading.
Summary
The Super Trend Line Channel Indicator helps traders identify breakout opportunities using a dynamic price channel.
Candle closes above or below the channel provides direct trade signals aligned with momentum.
Its customizable settings allow flexibility across trading styles and time frames.
Forex traders who focus on breakout strategies can use this tool to time entries and follow expanding market moves with greater precision.


