About the Bollinger Fibo Bands Indicator
The Bollinger Fibo Bands Indicator for MT5 combines the logic of Bollinger Bands with extended Fibonacci levels to create a volatility-based trading tool.
Instead of using the traditional upper and lower bands alone, this indicator plots additional levels based on Fibonacci ratios.
These extended bands help traders identify potential price reaction areas where the market may reverse, slow down, or continue moving with momentum.
The Fibonacci extensions provide extra reference levels beyond the standard Bollinger Band boundaries.
The indicator appears directly in the main price area and surrounds price with multiple dynamic bands.
As volatility increases, the bands expand outward, while during quiet market conditions they move closer together.
Because the levels are based on both volatility and Fibonacci calculations, traders can use the indicator to spot possible breakout zones, reversal points, and continuation opportunities. T
his makes the tool suitable for trend trading as well as pullback strategies.
Free Download
bollinger_fibo_bands.mq5 (MT5)
Key Features
- Combines Bollinger Bands with Fibonacci extension levels.
- Plots multiple volatility bands around the price.
- Helps identify possible reversal and breakout zones.
- Bands expand and contract based on market volatility.
- Supports both trend trading and pullback strategies.
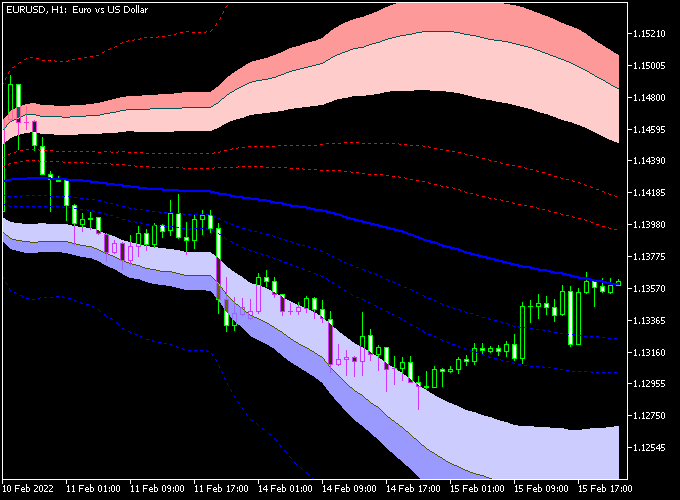
Indicator Chart
The Bollinger Fibo Bands Indicator surrounds price with several dynamic bands derived from Bollinger volatility calculations and Fibonacci ratios.
The chart below shows how price interacts with these outer levels, where reactions often appear as potential buy or sell areas during trending or ranging market conditions.

Guide to Trade with Bollinger Fibo Bands Indicator
Buy Rules
- Wait for the price to move toward the lower Fibonacci band.
- Watch for bullish price rejection near the lower band level.
- Confirm that price begins moving back toward the middle band.
- Open a buy trade once bullish momentum starts increasing.
Sell Rules
- Wait for the price to move toward the upper Fibonacci band.
- Watch for bearish rejection near the upper band level.
- Confirm that price begins moving back toward the middle band.
- Open a sell trade when bearish momentum increases.
Stop Loss
- Place the stop loss slightly below the outer Fibonacci band for buy trades.
- Place the stop loss slightly above the outer Fibonacci band for sell trades.
- Allow enough distance to account for volatility.
Take Profit
- Close the buy trade near the middle band or the next upper Fibonacci band.
- Close the sell trade near the middle band or the next lower Fibonacci band.
Bollinger Fibo Bands MT5 + TTM Squeeze Scalping Strategy
This strategy combines the Bollinger Fibo Bands indicator with the TTM Squeeze indicator to trade short-term expansions after brief consolidation phases.
It is applied on M1 and M5 charts where price transitions quickly from compression to movement.
The Bollinger Fibo Bands indicator provides directional context using the middle band.
When price holds above the blue middle band, the market is treated as bullish.
When price remains below it, conditions are considered bearish.
This acts as the baseline for trade direction.
The TTM Squeeze indicator highlights volatility contraction and release.
The first histogram bar above zero signals the start of bullish momentum, while the first bar below zero signals bearish momentum.
The setup is built around timing entries right as volatility begins to expand, but only in the direction defined by price positioning relative to the middle band.
Buy Entry Rules
- Confirm price is trading above the blue middle band.
- Wait for the first TTM Squeeze histogram bar to print above zero.
- Enter a buy trade at the close of that candle.
- Place the stop loss below the middle band or the nearest support level.
- Close the trade when a histogram bar prints below zero or when price closes back below the middle band.
Sell Entry Rules
- Confirm price is trading below the blue middle band.
- Wait for the first TTM Squeeze histogram bar to print below zero.
- Enter a sell trade at the close of that candle.
- Place the stop loss above the middle band or the nearest resistance level.
- Close the trade when a histogram bar prints above zero or when price closes back above the middle band.
Case Study 1: EURUSD M1 Buy Trade
On EURUSD M1, price stayed above the blue middle band, maintaining bullish positioning.
After a brief consolidation, the TTM Squeeze printed its first histogram bar above zero, indicating the start of upward momentum.
A buy trade was opened at the close of the signal candle and the stop loss was placed below a nearby support level.
The trade stayed open above the middle band and was closed 17 minutes later after a histogram bar printed below zero.
Case Study 2: GBPUSD M5 Sell Trade
On GBPUSD M5, price remained below the blue middle band, confirming bearish positioning.
Following a tight range, the TTM Squeeze printed its first histogram bar below zero.
A sell trade was entered after the signal candle closed and the stop loss was placed above a recent resistance level.
The trade continued while price stayed below the middle band and was closed 2 hours later when a histogram bar printed above zero.
Download Now
bollinger_fibo_bands.mq5 (MT5)
FAQ
What makes the Bollinger Fibo Bands different from standard Bollinger Bands?
The indicator adds Fibonacci extension levels to the traditional Bollinger Band calculation.
These extra bands provide more potential reaction zones where price may reverse or pause.
Can the indicator help identify breakout opportunities?
Yes. When price pushes strongly beyond the outer Fibonacci bands, it may signal increased momentum and a potential breakout move.
Which market conditions work best for this indicator?
The indicator works in both trending and ranging markets.
Traders often use the outer bands to detect possible reversals and the middle band as a dynamic target.
Summary
The Bollinger Fibo Bands Indicator expands the traditional Bollinger Band concept by adding Fibonacci-based volatility levels.
These extra bands give traders more reference points when analyzing price movement.
Because the bands react dynamically to volatility, the indicator helps identify potential reversal zones, breakout areas, and trend continuation opportunities.
Traders can use the levels to plan entries, manage risk, and define profit targets.
Overall, the Bollinger Fibo Bands Indicator offers a practical tool for traders who want more detailed price boundaries than standard Bollinger Bands alone.


