
About the TTM Squeeze Indicator
The TTM Squeeze indicator for MT5 is a versatile volatility and momentum tool designed to identify periods of market consolidation before a significant price breakout occurs.
By combining Bollinger Bands with Keltner Channels, the indicator determines when the market is in a “squeeze” phase, suggesting that a strong move is imminent.
Traders use this tool to navigate various market conditions by distinguishing between low-volatility environments and active trending phases.
It functions by plotting momentum bars that fluctuate around a zero line.
It is a reliable choice for those executing fast-paced strategies like scalping or day trading.
Free Download
Key Features
- Integrates Bollinger Bands and Keltner Channels to measure volatility compression.
- Features a color-coded histogram that displays momentum strength and trend direction.
- Identifies potential breakout points by highlighting the transition from low to high volatility.
- Offers customizable parameters for period lengths and deviations to suit different trading styles.
- Provides non-repainting signals that help traders maintain consistency in their execution.
Indicator Chart
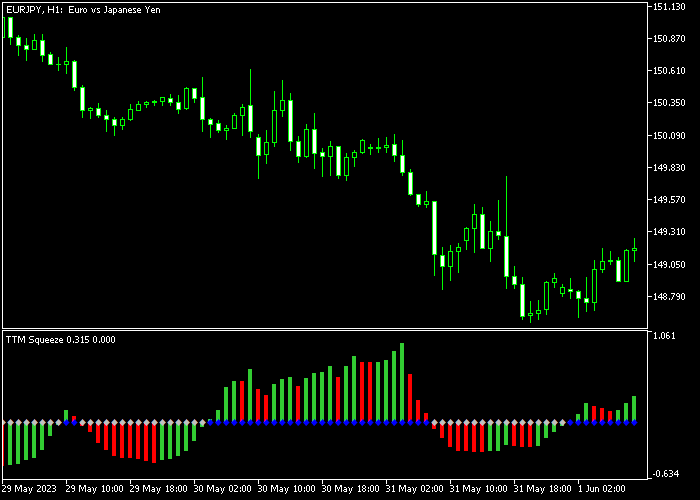
The chart displays the TTM Squeeze indicator positioned in the bottom sub-window below the price action.
The histogram bars change color to indicate momentum shifts, while their position relative to the zero line dictates the current trend bias.
Traders can use these fluctuations to pinpoint precise entry and exit levels during active market sessions.
Guide to Trade with TTM Squeeze Indicator
Buy Rules
- A buy signal arises when the TTM Squeeze bars turn back above 0 from below.
- Open a buy order immediately once the histogram bar closes in the positive zone.
- Ensure the overall market context aligns with a bullish bias for higher accuracy.
- Maintain the position as long as the histogram bars continue to rise or stay above zero.
Sell Rules
- A sell signal arises when the TTM Squeeze bars turn back below 0 from above.
- Open a sell order as soon as the histogram crosses into the negative territory.
- Look for confirmation from price action breaking below a recent support level.
- Keep the trade active until the momentum bars begin to lose strength or cross back up.
Stop Loss
- Place a stop loss slightly below the most recent technical support level for buy trades.
- For sell orders, set the stop loss slightly above the nearest technical resistance zone.
- Ensure the risk-to-reward ratio remains favorable before committing to the trade setup.
Take Profit
- Exit the trade for a fixed profit target based on a predetermined reward ratio.
- Alternatively, wait for a reversal signal where the histogram crosses the zero line again.
- Consider closing the position if the momentum bars start to flatten out significantly.
- Liquidate the order if the price reaches a major historical psychological level.
TTM Squeeze Forex MT5 Strategy with Ichimoku Confirmation
This strategy combines the TTM Squeeze Indicator with the Ichimoku Oscillator to create a fast and clean day trading system for M5 and M15 charts.
The TTM Squeeze indicator identifies momentum expansion after consolidation.
A histogram crossing back above the zero line signals bullish momentum, while a cross below zero signals bearish pressure.
The Ichimoku Oscillator provides trend confirmation using a dynamic relationship between price and Ichimoku components.
A bullish trend forms when the red line crosses above the yellow line from below, while a bearish trend is confirmed when the red line crosses back below.
This helps filter weak squeeze signals and improves directional accuracy during fast markets.
This strategy works best during London and New York sessions where volatility expands and breakout moves are more reliable on M5 and M15 timeframes.
Buy Entry Rules
- Wait for the TTM Squeeze histogram to cross back above the zero line, showing bullish momentum expansion.
- Confirm that the Ichimoku Oscillator red line crosses above the yellow line from below.
- Enter a buy trade at the close of the confirmation candle.
- Place the stop loss below the most recent swing low or below the last consolidation range.
- Trail the stop loss under recent swing structure as price expands upward.
- Exit the trade when the TTM histogram crosses back below zero or when the Ichimoku Oscillator red line crosses below the yellow line.
Sell Entry Rules
- Wait for the TTM Squeeze histogram to cross back below the zero line, showing bearish momentum expansion.
- Confirm that the Ichimoku Oscillator red line crosses below the yellow line from above.
- Enter a sell trade at the close of the confirmation candle.
- Place the stop loss above the most recent swing high or above the last consolidation range.
- Trail the stop loss above recent swing structure as price moves downward.
- Exit the trade when the TTM histogram crosses back above zero or when the Ichimoku Oscillator red line crosses above the yellow line.
Case Study 1: Buy Trade Example (EUR/USD M5 London Session)
The TTM Squeeze histogram crossed above the zero line after a short consolidation phase, showing that bullish momentum was expanding.
At the same time, the Ichimoku Oscillator confirmed strength as the red line crossed above the yellow line from below.
A buy trade was opened at the candle close. Price quickly expanded upward as volatility increased, creating a smooth intraday push.
The long position was exited once the TTM histogram closed back below the zero line.
Case Study 2: Sell Trade Example (GBP/JPY M15 New York Session)
The TTM Squeeze histogram crossed below the zero line after a tight range, signaling the start of bearish momentum expansion.
The Ichimoku Oscillator confirmed the move as the red line crossed below the yellow line from above.
A sell trade was opened at the candle close. Price moved lower in a structured impulse as volatility increased.
The stop loss was kept above the recent swing high and adjusted as price progressed.
The trade was closed when the TTM histogram crossed back above zero and the Ichimoku Oscillator started to reverse, indicating that the bearish phase was ending.
Download Now
FAQ
How do the Bollinger Bands and Keltner Channels interact in this indicator?
The squeeze occurs when the Bollinger Bands trade inside the Keltner Channels. This signifies a period of very low volatility.
When the bands expand and move outside the channels, the squeeze is released, often resulting in a sharp price movement.
Can I use this indicator for M1 and M5 scalping?
Yes, the indicator is effective for short-term trading.
For M1 and M5 chart traders, it is best to deploy the indicator on lower spread forex pairs to maximize performance and reduce the impact of trading costs during quick entries.
Which settings should I adjust for better signals?
You can modify the BB period, BB deviation, and Keltner period within the inputs.
Increasing the period will smooth out the signals and reduce false breakouts, while decreasing the period makes the indicator more sensitive to minor price fluctuations.
Summary
The TTM Squeeze indicator for MT5 provides a streamlined approach to technical analysis by merging trend detection with momentum filtering.
Because the signals do not repaint, the tool remains a reliable choice for those executing fast-paced strategies like scalping or day trading.
Overall, it serves as an essential component for any strategy requiring a precise understanding of market cycles and momentum shifts.


