
About the Fibonacci Arc Indicator
The Fibonacci Arc Indicator for MT5 is a technical analysis tool used to identify dynamic support and resistance levels on the price area.
It applies Fibonacci ratios in the form of curved arcs that project possible reaction zones as the market moves over time.
These arcs take both price and time into account, allowing traders to analyze how price may interact with key levels as the trend progresses.
The indicator appears directly on the price area and draws curved Fibonacci levels that can act as potential turning points.
When the market approaches one of these arcs, traders watch closely for a breakout or a bounce from the level.
Because the arcs adapt to price movement, they can help traders visualize areas where momentum may accelerate or slow down.
Many traders combine Fibonacci arcs with trend analysis to identify possible breakout or continuation opportunities.
Free Download
Key Features
- Plots Fibonacci arcs directly on the price area.
- Helps identify dynamic support and resistance zones.
- Uses Fibonacci ratios to project potential market reactions.
- Curved levels incorporate both price and time movement.
- Useful for identifying breakout or bounce opportunities.
- Simple visual tool for analyzing market structure.
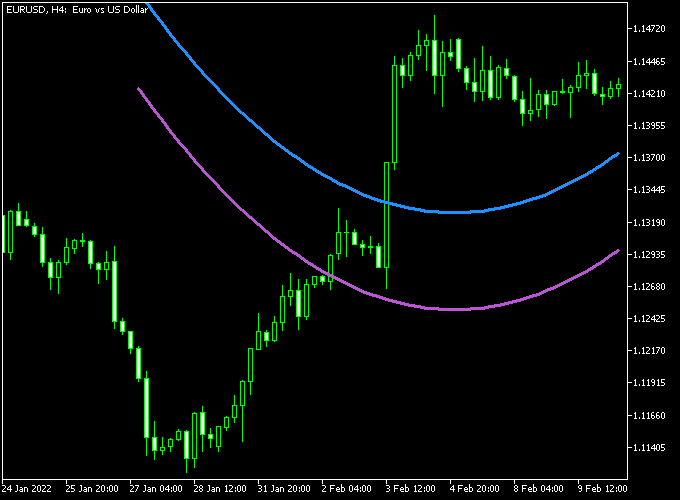
Indicator Chart
The Fibonacci Arc Indicator appears on the price area as curved lines projected from a key swing point.
These arcs represent potential support and resistance levels where the market may react as price moves through the trend.
Guide to Trade with the Fibonacci Arc Indicator
Buy Rules
- Observe when price approaches the upper blue Fibonacci arc.
- Confirm that the overall market trend is moving upward.
- Wait for price to break and close above the upper arc level.
- Open a buy trade once the breakout is confirmed.
Sell Rules
- Watch when price approaches the lower purple Fibonacci arc.
- Confirm that the overall market direction is downward.
- Wait for price to break and close below the lower arc level.
- Open a sell trade after the bearish breakout occurs.
Stop Loss
- Place the stop loss slightly below the breakout arc for buy trades.
- Place the stop loss slightly above the breakout arc for sell trades.
- Allow some space to avoid premature stop outs.
Take Profit
- Target the next projected Fibonacci arc level.
- Close part of the position when price reaches nearby resistance or support.
- Exit the trade if momentum weakens near a major price level.
Fibonacci Arc Indicator MT5 Breakout Strategy with Jurik Moving Average
This breakout strategy combines the Fibonacci Arc Indicator with the Jurik Moving Average Indicator to capture strong price expansions after key levels are broken.
The Fibonacci Arc Indicator plots curved support and resistance zones based on price swings.
The blue arc acts as support and the purple arc acts as resistance.
When price closes beyond these arcs, it signals a breakout beyond a key level where market pressure shifts.
The Jurik Moving Average confirms the underlying trend direction.
When price is above the JMA, the market is considered bullish. When price is below the JMA, it reflects bearish conditions.
This strategy is designed for M15 and H1 charts where breakout structures are clearer and false signals are reduced due to stronger price movement.
Buy Entry Rules
- Wait for the price to be above the Jurik Moving Average to confirm a bullish trend.
- Identify the upper blue Fibonacci Arc level.
- Wait for a candle to close above the upper blue arc.
- Enter a buy trade at the close of the breakout candle.
- Place the stop loss below the breakout candle low or below the blue arc level.
- Exit the trade when price closes back below the Jurik Moving Average.
- Alternatively, exit when price closes back inside the Fibonacci Arc structure below the blue arc.
Sell Entry Rules
- Wait for the price to be below the Jurik Moving Average to confirm a bearish trend.
- Identify the lower purple Fibonacci Arc level.
- Wait for a candle to close below the purple arc.
- Enter a sell trade at the close of the breakout candle.
- Set the stop loss above the breakout candle high or above the purple arc level.
- Exit the trade when price closes back above the Jurik Moving Average.
- Alternatively, exit when price closes back inside the Fibonacci Arc structure above the purple arc.
Case Study 1: NZDUSD M15 Buy Breakout
On NZDUSD M15, price moved above the Jurik Moving Average, confirming a bullish trend.
The market approached the upper blue Fibonacci Arc level and began compressing near resistance.
A strong bullish candle closed above the blue arc, confirming a breakout.
A buy trade was entered at the close of that candle.
The stop loss was placed below the breakout candle low and just under the blue arc level.
Price continued higher until a candle closed back below the Jurik Moving Average.
The trade was closed because the Jurik Moving Average indicated a loss of bullish trend direction.
Case Study 2: AUDCAD H1 Sell Breakout
On AUDCAD H1, price stayed below the Jurik Moving Average, confirming bearish conditions.
The market tested the purple Fibonacci Arc support level several times before breaking lower.
A strong bearish candle closed below the purple arc, confirming the breakout. A sell trade was entered at the candle close.
The stop loss was placed above the breakout candle high and slightly above the purple arc level.
Price moved downward and later closed back above the Jurik Moving Average.
The trade was closed because the Jurik Moving Average signaled a shift away from the bearish trend.
Download Now
FAQ
What are Fibonacci arcs used for?
Fibonacci arcs are used to identify curved support and resistance levels based on Fibonacci ratios.
These levels help traders analyze how price might react as it moves forward in time.
How are Fibonacci arcs different from Fibonacci retracements?
Fibonacci retracements use horizontal levels, while Fibonacci arcs use curved levels that incorporate both price movement and time progression.
Can the Fibonacci Arc Indicator be used with other tools?
Yes. Many traders combine Fibonacci arcs with trendlines, moving averages, or price action analysis to improve their market interpretation.
Summary
The Fibonacci Arc Indicator provides a different perspective on support and resistance by projecting curved levels that follow the progression of price over time.
These arcs highlight areas where the market may pause, reverse, or accelerate.
Because the arcs expand across the chart, traders can observe how price interacts with projected levels as the trend develops.
This helps identify potential breakout or reaction zones.
The indicator can be applied to many markets and timeframes, giving traders another method to study market behavior and potential turning points.


