
About the Linear Regression Forex Indicator
The Linear Regression Forex Indicator for Metatrader 4 is a trend-following tool that plots a structured regression channel on the chart to reveal the prevailing market direction.
Showing multiple channel levels allows traders to identify trend strength, pullbacks, and potential entry or exit points with precision.
Displayed in the main MT4 chart window, the indicator consists of three upper gray channel lines, three lower gray channel lines, and a central yellow linear regression line.
The upper and lower lines highlight key price extremes, while the middle line provides a visual reference for the trend’s average direction.
Traders can use it independently to gauge trend and timing, or combine it with other indicators to improve trade confirmation.
Free Download
Download the “Linear_Regression.mq4” indicator for MT4
Key Features
- Seven-line linear regression channel to visualize trend and price extremes
- Three upper and three lower gray lines for pullback identification
- A yellow middle line to indicate the average trend direction
- Helps traders plan trades based on trend direction and channel levels
Indicator Chart
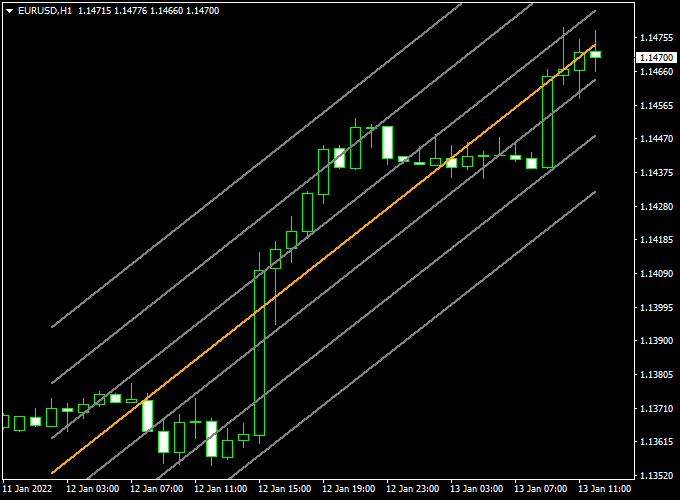
The chart example shows the Linear Regression Forex Indicator applied to an MT4 chart.
The gray upper and lower lines highlight price extremes, while the yellow middle line displays the trend’s average.
Price interaction with the channel boundaries often provides potential buy or sell opportunities.
Guide to Trade with Linear Regression Forex Indicator
Buy Rules
- Ensure the regression channel is sloping upwards
- Enter a buy trade when the price touches the lower gray channel line from above
Sell Rules
- Ensure the regression channel is sloping downwards
- Enter a sell trade when the price touches the upper gray channel line from below
Stop Loss
- Place a stop loss slightly beyond the channel line opposite the entry
- For buy trades, set the stop below the lower gray channel line
- For sell trades, set a stop above the upper gray channel line
Take Profit
- Set the take profit at the opposite channel line
- Consider partial exits at the middle yellow line for conservative trades
- Extend targets if the trend slope remains strong
Practical Tips
- Avoid trading when the channel flattens or compresses
- Watch price reactions at the channel extremes for potential reversals
Linear Regression Forex Indicator and X Super Trend Candles Indicator Forex Strategy
This MT4 intraday strategy combines the trend-following signals of the Linear Regression Forex Indicator with the precise entry signals from the X Super Trend Candles Forex Indicator.
The strategy is designed for traders looking to capture intraday price movements on active currency pairs.
It works best on 5-minute to 15-minute charts.
The Linear Regression Forex indicator identifies the overall trend: an upward-sloping channel with price above the orange midline indicates a bullish trend, while a downward-sloping channel with price below the midline indicates a bearish trend.
The X Super Trend Candles provide trade entries: green candles indicate buy signals and red candles indicate sell signals.
Buy Entry Rules
- Confirm the Linear Regression Forex Indicator shows an upward-sloping channel with price above the orange midline, indicating a bullish trend.
- Wait for a green candle on the X Super Trend Candles indicator, signaling a buy entry.
- Enter a buy trade at the market price once both conditions are met.
- Set a stop loss below the recent swing low or the lower boundary of the regression channel.
- Set a take profit for 10–35 pips or near the next resistance level, depending on market volatility.
Sell Entry Rules
- Confirm the Linear Regression Forex Indicator shows a downward-sloping channel with price below the orange midline, indicating a bearish trend.
- Wait for a red candle on the X Super Trend Candles indicator, signaling a sell entry.
- Enter a sell trade at the market price once both conditions are met.
- Set a stop loss above the recent swing high or the upper boundary of the regression channel.
- Set a take profit for 10–35 pips or near the next support level, depending on market volatility.
Advantages
- Combines trend direction with precise entry signals for higher accuracy.
- Works effectively on intraday charts, allowing multiple trading opportunities per session.
- Clear visual indicators reduce guesswork and simplify decision-making.
Drawbacks
- Requires constant monitoring during intraday sessions for timely entries.
- May underperform during extended sideways market periods.
Case Study 1: EUR/JPY on 5-Minute Chart
On the EUR/JPY 5-minute chart, the Linear Regression Forex Indicator showed an upward-sloping channel with price above the orange midline, indicating a bullish trend.
A green candle appeared on the X Super Trend Candles indicator, confirming the buy entry.
The trade was entered at 142.50, with a stop loss at 142.40 and a take profit at 142.65.
The trade closed successfully with a 15-pip gain within 20 minutes.
Case Study 2: AUD/USD on 15-Minute Chart
On the AUD/USD 15-minute chart, the Linear Regression Forex Indicator displayed a downward-sloping channel with price below the orange midline, signaling a bearish trend.
A red candle on the X Super Trend Candles indicator confirmed the sell entry.
The trade was entered at 0.6750, with a stop loss at 0.6760 and a take profit at 0.6735.
The trade reached the take profit target, netting 15 pips within 30 minutes.
Strategy Tips
- Always confirm the trend with the Linear Regression Forex Indicator before taking entries from X Super Trend Candles.
- Use recent swing highs and lows or regression channel boundaries to set stop loss and take profit levels accurately.
- Adjust the take profit based on currency pair volatility and intraday market conditions.
Download Now
Download the “Linear_Regression.mq4” indicator for Metatrader 4
FAQ
What do the multiple channel lines represent?
The upper and lower gray lines indicate price extremes for potential pullbacks, while the yellow middle line represents the trend’s average direction.
Does the channel repaint?
The channel adjusts as new price data develops but does not randomly repaint past levels. It reflects evolving market conditions while maintaining historical levels for reference.
Summary
The Linear Regression Forex Indicator for MT4 provides a structured 7-line channel to identify trends, price extremes, and potential entry points.
By following the slope of the channel and observing price interactions, traders can plan trades with greater confidence.
The indicator is suitable for all timeframes and symbols and can be combined with other technical tools for improved confirmation.
It works well for both swing and intraday trading strategies.
Observing how price reacts along the multiple channel lines allows traders to spot high-probability entries, optimize stop loss and take profit placement, and maintain disciplined, trend-aligned trading.


