
About the Balance of Power Indicator
The Balance of Power Indicator for MT5 is a momentum-based tool developed by Igor Livshin to measure the strength between buyers and sellers.
It evaluates how effectively each side pushes price toward its extremes, giving insight into market control.
The indicator oscillates between -1 and +1, where positive values reflect buying pressure and negative values indicate selling pressure.
It can also be smoothed using a moving average to reduce noise and improve signal consistency.
One of its key characteristics is how it behaves during trends.
In strong bullish markets, it tends to remain near the upper range, while in bearish markets, it stays near the lower range.
This behavior helps traders confirm trend direction and identify potential reversals.
Free Download
Balance of Market Power.ex5 (MT5)
Key Features
- Measures the strength of buyers versus sellers.
- Oscillates between -1 and +1 for easy interpretation.
- Supports divergence analysis and trend confirmation.
- Optional smoothing using moving averages.
- Highlights overbought and oversold conditions.
- Adapts to different timeframes and market conditions.
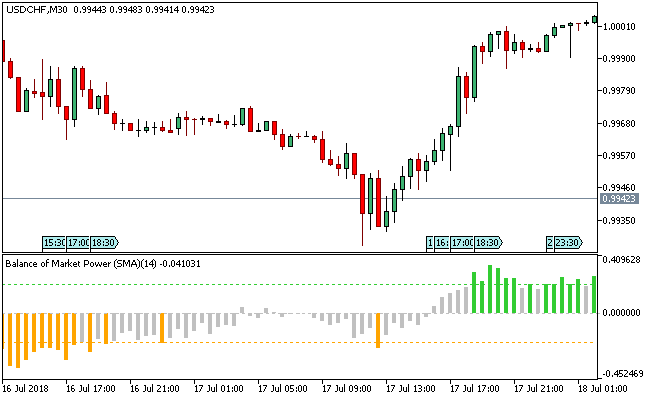
Indicator Chart
The Balance of Power Indicator appears beneath the price area as a histogram that fluctuates around the zero level.
The chart shows how the bars change color and direction, helping traders identify shifts in market pressure and potential entry points.
Guide to Trade with Balance of Power Indicator
Buy Rules
- Wait for the histogram to break above the zero level.
- Confirm increasing bullish strength with rising bars.
- Look for consistency in positive momentum.
- Enter a buy trade at the next candle open.
Sell Rules
- Wait for the histogram to drop below the zero level.
- Confirm growing bearish pressure with falling bars.
- Look for sustained movement in negative territory.
- Enter a sell trade at the next candle open.
Stop Loss
- Place stop loss based on a fixed risk-to-reward ratio such as 1:1 or 1:2.
- Set stop loss beyond recent price rejection zones.
- Reduce position size instead of widening stops excessively.
Take Profit
- Close buy trades when the histogram crosses back below the zero level.
- Close sell trades when the histogram crosses back above the zero level.
- Alternatively, take profit at predefined risk-reward targets.
MT5 Scalping Strategy Using Balance of Power Indicator
This scalping strategy combines the Balance of Power Indicator with the Silver Trend Signal Indicator to capture short intraday moves on M5 and M15 charts.
The Balance of Power Indicator measures buying and selling pressure through histogram behavior.
Consecutive green bars above zero reflect sustained bullish control, while consecutive orange bars below zero reflect established bearish pressure.
The Silver Trend Signal Indicator provides directional triggers through arrows on the price chart.
A green arrow signals a buy setup, while a red arrow signals a sell setup.
This strategy is applied to pairs such as EURUSD, GBPJPY, USDCHF, AUDUSD, and XAUUSD during London and New York sessions where directional movement is more stable.
Buy Entry Rules
- Confirm consecutive green bars above the zero level on the Balance of Power Indicator.
- Wait for a green arrow from the Silver Trend Signal Indicator.
- Enter a buy trade at the close of the signal candle on M5 or M15 charts.
- Place the stop loss below the most recent swing low or below the last cluster of orange bars.
- Close the trade when orange bars begin printing below zero, indicating a shift in buying pressure.
- Alternative exit: close the trade when a red arrow appears, signaling bearish entry conditions.
Sell Entry Rules
- Confirm consecutive orange bars below the zero level on the Balance of Power Indicator.
- Wait for a red arrow from the Silver Trend Signal Indicator.
- Enter a sell trade at the close of the signal candle on M5 or M15 charts.
- Place the stop loss above the most recent swing high or above the last cluster of green bars.
- Close the trade when green bars begin printing above zero, indicating a shift in selling pressure.
- Alternative exit: close the trade when a green arrow appears, signaling bullish entry conditions.
Case Study 1
On EURUSD M15, the Balance of Power Indicator printed consecutive green bars above zero after a short consolidation phase near intraday support.
A green arrow from the Silver Trend Signal Indicator appeared shortly after.
A buy trade was opened and the protective stop loss was placed below the most recent swing low formed before continuation.
Later in the session, orange bars began printing below zero and our long trade was closed as selling pressure took control of price structure.
Case Study 2
On GBPJPY M5, price moved lower in a strong impulse and the Balance of Power Indicator showed consecutive orange bars below zero.
A red arrow from the Silver Trend Signal Indicator appeared during the move.
A sell trade was opened at candle close and the stop loss was placed above the last rejection high.
About 3 hours later, green bars began appearing above zero and the short trade was closed as buying pressure returned and bearish structure broke.
Download Now
Balance of Market Power.ex5 (MT5)
FAQ
What does the zero level represent in the Balance of Power Indicator?
The zero level acts as a dividing line between bullish and bearish pressure.
Values above zero indicate buyers are in control, while values below zero show sellers are dominant.
Can the Balance of Power Indicator show divergence?
Yes, it can highlight divergence between price and momentum.
This can signal potential reversals when price moves in one direction while the indicator moves in the opposite direction.
How does smoothing affect the indicator?
Smoothing reduces noise and makes signals more stable.
However, it may slightly delay entries compared to the raw version.
What does clustering near extremes mean?
When the indicator stays near its upper or lower limits, it reflects strong trend conditions where one side consistently dominates the market.
Summary
The Balance of Power Indicator offers a focused view of market strength by comparing buyer and seller influence.
Its simple histogram format makes it easy to track momentum shifts and confirm trends.
It performs effectively across multiple timeframes and supports both trend-following and reversal strategies.
The ability to detect divergence adds further depth to trade analysis.
When combined with additional confirmation tools, it can enhance decision-making and improve overall trading consistency.


