
About the Boom and Crash Spike Detector Indicator
The Boom and Crash Spike Detector indicator for MT5 is designed to help traders identify potential spike movements in Boom and Crash indices.
These synthetic indices are known for sudden upward or downward spikes, which create unique trading opportunities when detected early.
The indicator analyzes several technical factors to locate these potential movements.
It combines support and resistance levels, moving averages, price divergence, and price action logic to detect areas where spikes may occur.
This combination helps traders anticipate sudden price shifts rather than reacting after they happen.
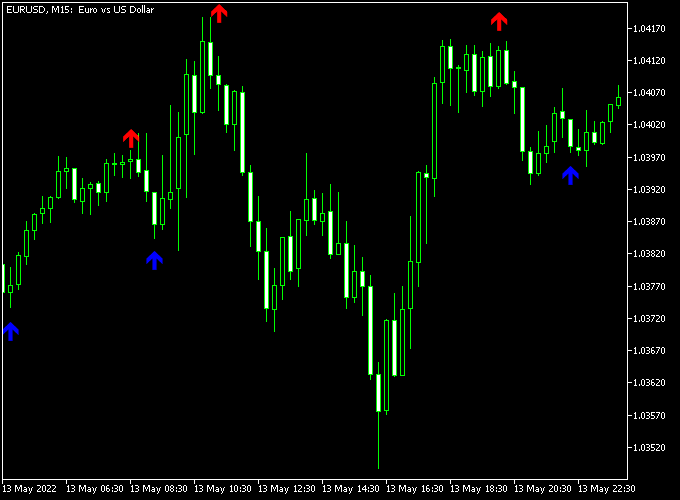
The signals are displayed directly on the price area using arrows.
A blue arrow signals a potential buy opportunity, while a red arrow highlights a potential sell setup.
Although the indicator was developed primarily for Boom and Crash indices such as Boom 500, Boom 1000, Crash 500, and Crash 1000, it can also be applied to forex pairs.
Many traders experiment with it on shorter timeframes for scalping strategies.
Free Download
boom-crash-spike-detector.ex5 (MT5)
Key Features
- Designed to detect spike opportunities in Boom and Crash indices.
- Displays buy and sell arrows directly on the price area.
- Combines support and resistance with moving average analysis.
- Includes price divergence and price action elements.
- Compatible with synthetic indices and forex pairs.
- Suitable for short-term trading and scalping approaches.
Indicator Chart
The Boom and Crash Spike Detector Indicator appears on the main price area and plots blue buy arrows and red sell arrows.
These signals highlight potential spike setups, helping traders identify moments when sharp price movements may occur.
Guide to Trade with Boom and Crash Spike Detector Indicator
Buy Rules
- Wait for a blue buy arrow to appear on the price area.
- Confirm that the signal forms near a support level or after a pullback.
- Open a buy trade once the signal candle closes.
- Avoid entering trades during extremely volatile market conditions.
Sell Rules
- Wait for a red sell arrow to appear on the price area.
- Confirm that the signal appears near a resistance zone.
- Open a sell trade once the signal candle completes.
- Avoid entering trades during major news events or unstable conditions.
Stop Loss
- Place the stop loss below recent support for buy trades.
- Place the stop loss above recent resistance for sell trades.
Take Profit
- Close the buy trade when a new red arrow appears.
- Close the sell trade when a new blue arrow appears.
- Some traders secure profits after a strong spike move.
MT5 Boom and Crash Spike Detector + Super Trend Hull Scalping Strategy
This scalping strategy combines the Boom and Crash Spike Detector with the Super Trend Hull indicator to capture fast intraday spike movements with structured trend confirmation.
The Spike Detector provides precise entry signals using blue arrows for buys and red arrows for sells.
The Super Trend Hull indicator filters trades using trend direction, where a green Hull line signals bullish momentum and a violet Hull line signals bearish momentum.
It is mainly used during active volatility phases when Boom or Crash style impulses appear.
The goal is to trade only when both indicators agree, ensuring entries are aligned with trend direction and confirmed by a spike-based signal.
This reduces random entries and focuses on structured scalp setups.
Buy Entry Rules
- Super Trend Hull indicator shows a green line indicating bullish trend conditions.
- Wait for a blue buy arrow from the Boom and Crash Spike Detector.
- Enter a buy trade immediately after the signal candle closes following the blue arrow.
- Stop loss is placed below the most recent micro swing low formed before the signal.
- Take profit is triggered when the Spike Detector prints a red sell arrow, which signals a spike reversal and closes the full buy position.
Sell Entry Rules
- Super Trend Hull indicator shows a violet line indicating bearish trend conditions.
- Wait for a red sell arrow from the Boom and Crash Spike Detector.
- Enter a sell trade after the signal candle closes confirming downward spike momentum.
- Stop loss is placed above the most recent micro swing high formed before the signal.
- Take profit is triggered when the Spike Detector prints a blue buy arrow, which indicates a reversal spike and closes the full sell position.
Case Study 1 Buy Scenario (EURJPY M1)
EURJPY moved into a bullish intraday phase where the Super Trend Hull indicator turned green and remained stable during a short consolidation.
Price then showed hesitation before the Boom and Crash Spike Detector printed a blue buy arrow.
A buy trade was opened after candle close confirmation.
The trade was closed later when the Spike Detector printed a red sell arrow, signaling a sudden reversal spike against the position.
The exit was executed because the indicator confirmed a full shift in spike direction.
Case Study 2 Sell Scenario (XAUUSD M5)
XAUUSD showed bearish structure as the Super Trend Hull indicator remained violet during a downward drift.
After a small pullback, the Boom and Crash Spike Detector printed a red sell arrow aligned with the trend.
A sell position was entered after candle close confirmation.
The trade was closed when the Spike Detector generated a blue buy arrow, indicating a strong reversal spike against the position.
Download Now
boom-crash-spike-detector.ex5 (MT5)
FAQ
Can the indicator be used for scalping?
Yes. Some traders use the indicator on shorter timeframes to capture quick price movements, particularly on volatile instruments.
Does the indicator rely on one technical method?
No. The indicator combines several analysis techniques including support and resistance, moving averages, divergence, and price action to identify spike setups.
Summary
The Boom and Crash Spike Detector Indicator focuses on identifying sudden price movements that frequently occur in synthetic indices.
The arrow signals provide a simple visual method to detect potential spike setups.
Its approach combines several technical techniques to locate areas where momentum may accelerate quickly.
This helps traders monitor moments where strong movements could appear.
The indicator can be used on Boom and Crash indices as well as forex pairs, making it a flexible tool for traders who want to watch for rapid market moves.


