
About the Average of 18 Moving Averages Indicator
The Average of 18 Moving Averages Indicator for MT5 is a trend following tool that combines multiple moving average calculations into a single line on the platform.
Instead of relying on one moving average, the indicator calculates the average value of eighteen different moving averages to provide a smoother view of the overall trend.
The calculation includes several popular moving average types such as the simple moving average, exponential moving average, smoothed moving average, linear weighted moving average, triangular moving average, and the Hull moving average.
By combining these methods, the indicator filters short term noise and highlights broader market direction.
This makes it useful for traders who want to identify the dominant trend and trade in the same direction as market momentum.
Free Download
Key Features
- Combines the average value of eighteen moving averages.
- Includes SMA, EMA, SMMA, LWMA, TMA, and Hull moving average calculations.
- Helps identify the dominant market trend.
- Useful for both trade entries and exits.
- Works with crossover and trend following strategies.
- Simple interpretation using price position relative to the indicator.
- Adjustable period and applied price parameters.
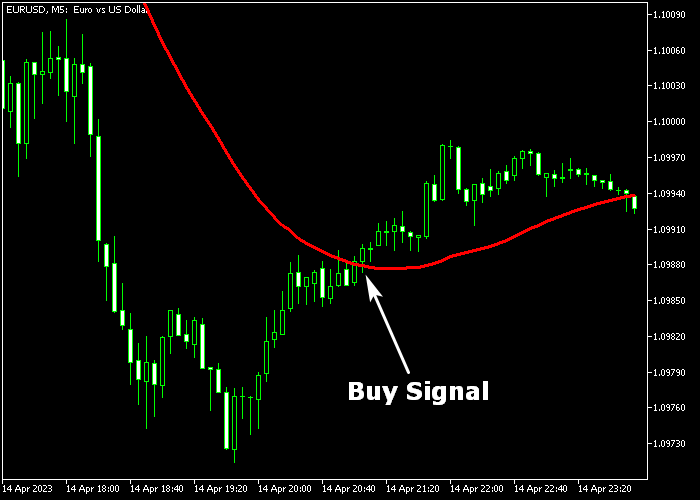
Indicator Chart
The Average of 18 Moving Averages Indicator appears in the main price window as a smooth trend line.
When price moves above the line it signals bullish conditions, while price trading below the line reflects bearish momentum.
Guide to Trade with the Average of 18 Moving Averages Indicator
Buy Rules
- Wait for the candle to close above the Average of 18 Moving Averages line.
- Confirm that the move occurs after price approaches the indicator from below.
- Open a buy trade once bullish momentum continues above the line.
- Avoid entering if price is approaching strong resistance.
Sell Rules
- Wait for the candle to close below the Average of 18 Moving Averages line.
- Confirm that price previously traded above the indicator.
- Open a sell trade once bearish momentum continues below the line.
- Avoid selling directly into strong support levels.
Stop Loss
- Set the stop loss a few pips below the indicator line for buy trades.
- Set the stop loss a few pips above the indicator line for sell trades.
- Use the indicator as a dynamic support/resistance level to trail your stop if the trend continues.
Take Profit
- Close the buy trade if price moves back below the indicator line.
- Close the sell trade if price moves back above the indicator line.
- Alternatively, exit the trade at a fixed profit target.
- Secure profits early if price approaches major support or resistance.
Average of 18 Moving Averages Forex Strategy for MT5
This Forex strategy combines the Average of 18 Moving Averages Indicator with the XO Indicator to create a clear and reliable trading approach.
The idea behind this method is simple. One indicator defines the overall trend while the other confirms momentum and timing.
The Average of 18 Moving Averages smooths out market noise and shows the dominant direction.
This helps traders avoid false signals and focus only on strong trends.
The XO Indicator adds precision by highlighting shifts in bullish and bearish momentum.
This strategy works best on M15 to H1 timeframes.
It fits traders who want a balanced approach between intraday trading and short-term swing trading.
Buy Entry Rules
- Wait for price to move above the Average of 18 Moving Averages, confirming a bullish trend.
- Check the XO Indicator for a green box above the zero level to confirm buying momentum.
- Enter a buy trade at the opening of the next candle after confirmation.
- Place the stop loss below the most recent swing low or below the moving average line.
- Take profit when the XO Indicator shows a red box or when price shows signs of rejection near resistance.
- You can also target a fixed risk to reward ratio such as 1:2.
Sell Entry Rules
- Wait for price to move below the Average of 18 Moving Averages, confirming a bearish trend.
- Check the XO Indicator for a red box below the zero level to confirm selling pressure.
- Enter a sell trade at the opening of the next candle after confirmation.
- Place the stop loss above the most recent swing high or above the moving average line.
- Take profit when the XO Indicator shows a green box or when price reacts near support.
- A fixed risk to reward target can also be used.
Case Study 1: Trend Direction with Moving Averages
On the EURUSD pair using the H1 timeframe, price moved clearly above the Average of 18 Moving Averages line.
This signaled a strong bullish environment. Shortly after, the XO Indicator confirmed momentum with a green signal above zero.
A buy trade was opened at the next candle. The stop loss was placed below a recent swing low.
Price continued rising steadily, respecting the moving average as dynamic support.
The trade was closed when momentum slowed and the XO Indicator printed a red signal.
The position captured a clean trend move.
Case Study 2: XO Indicator Momentum Confirmation
On GBPJPY using the M15 timeframe, the XO Indicator printed a green box above zero, signaling a potential buy opportunity.
At the same time, price was already positioned above the Average of 18 Moving Averages, confirming alignment between trend and momentum.
A buy trade was entered at the next candle open. The stop loss was placed just below the moving average line to protect against a reversal.
Price pushed higher with strong momentum.
The trade was closed when a red box appeared on the XO Indicator, signaling weakening bullish pressure.
Download Now
FAQ
Why does the indicator use 18 moving averages?
The indicator averages multiple moving average calculations to create a smoother trend line that reduces short term market noise.
What moving average types are included in the calculation?
The calculation includes simple, exponential, smoothed, linear weighted, triangular, and Hull moving averages.
Can this indicator be used as a trend filter?
Yes. Many traders use it to determine the main market direction before entering trades with other strategies.
Which parameter can be adjusted?
The main adjustable settings include the moving average period and the applied price used for the calculation.
Summary
The Average of 18 Moving Averages Indicator provides a broader view of market direction by combining multiple moving average calculations into a single trend line.
Traders can use the indicator to identify bullish and bearish phases based on the position of price relative to the line.
It can also serve as a trend filter when used alongside other technical tools.
With a simple interpretation method and customizable settings, the indicator offers a practical solution for traders who want a smoother moving average based trend analysis tool.


