
About the Boom and Crash Gold Miner v2 Indicator
The Boom and Crash Gold Miner v2 Trend Indicator for MT5 is a straightforward trend-following tool designed specifically for Boom and Crash markets.
It helps traders identify bullish and bearish phases using colored trend bars displayed in a separate window below the main price area.
The indicator prints blue bars during bullish conditions and orange bars during bearish conditions.
A color shift signals a potential trend reversal and a new trading opportunity.
Its internal calculation is based on deviation, trend period, and trend power inputs.
Traders can adjust these settings to match scalping, intraday, or swing trading approaches.
The visual format makes it easy to follow trend transitions without overcomplicating the decision process.
Free Download
Boom and Crash Gold Miner v2 Trend.ex5 Indicator (MT5)
Key Features
- Displays blue bullish and orange bearish trend bars in a separate window.
- Generates signals when the bar color changes.
- Adjustable deviation, trend period, and trend power settings.
- Works on Boom and Crash indices across all time frames.
- Simple visual format that highlights current trend direction.
Indicator Chart
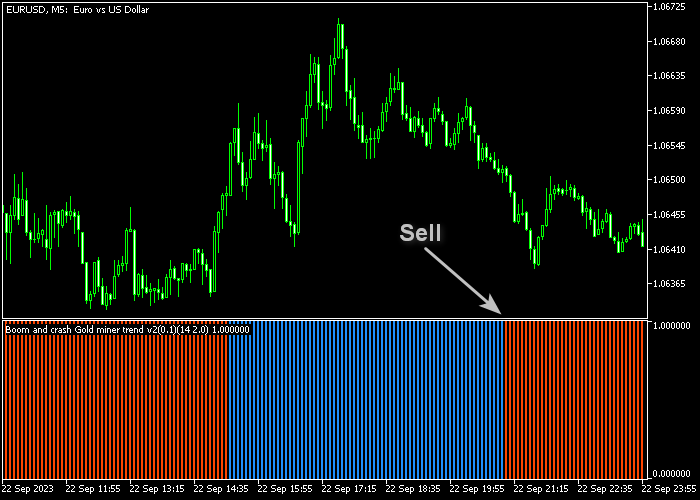
The Boom and Crash Gold Miner v2 Trend Indicator appears below the main price area as a sequence of blue and orange bars.
When the bars switch from orange to blue, it signals a potential bullish move. When they switch from blue to orange, it indicates possible bearish momentum.
Traders use these transitions to time entries in the direction of the new trend.
Guide to Trade with Boom and Crash Gold Miner v2 Trend Indicator
Buy Rules
- Wait for the colored bar to switch from orange to blue.
- Confirm that the new blue bar closes fully to validate the signal.
- Execute a buy market order at the open of the next candle.
- Ensure overall market momentum supports a bullish continuation.
Sell Rules
- Wait for the colored bar to switch from blue to orange.
- Confirm that the new orange bar closes fully to validate the signal.
- Execute a sell market order at the open of the next candle.
- Ensure overall market pressure favors a bearish move.
Stop Loss
- Place the stop loss below short-term support for buy trades.
- Place the stop loss above short-term resistance for sell trades.
- Keep position size aligned with your risk management rules.
Take Profits
- Close buy trades at a fixed target such as +15 pips on lower time frames.
- Close sell trades at a fixed target such as +40 pips on higher time frames.
- Alternatively, close the trade when the bar switches to the opposite color.
- Trail the position if the trend continues strongly in your favor.
Boom and Crash Gold Miner V2 and Bykov HFT MT5 Scalping Strategy
This fast chart scalping strategy combines the Boom and Crash Gold Miner V2 Trend Indicator for MT5 and the Bykov Trend HFT Indicator for MT5 to capture rapid intraday movements on Boom, Crash, and Forex charts.
The Boom and Crash Gold Miner V2 indicator signals entry when the colored bars switch: orange to blue for buy trades and blue to orange for sell trades.
The Bykov Trend HFT indicator confirms the trend with green arrows indicating bullish bias and magenta arrows indicating bearish bias.
This combination is designed for fast charts, including 1-minute and 5-minute timeframes, ideal for scalpers targeting quick gains with precise trend alignment.
Buy Entry Rules
- Confirm the trend using the Bykov Trend HFT indicator. A green arrow must be visible, indicating a bullish trend.
- Wait for the Boom and Crash Gold Miner V2 bar to switch from orange to blue.
- Open a buy trade immediately after the color switch while the trend remains bullish.
- Place the stop loss just below the recent minor support or below the start of the new blue bar.
- Set the take profit between 7 and 30 pips or points depending on volatility.
- Exit immediately if a magenta Bykov arrow appears or if the bar switches back to orange.
Sell Entry Rules
- Confirm the trend using the Bykov Trend HFT indicator. A magenta arrow must be present, indicating a bearish trend.
- Wait for the Boom and Crash Gold Miner V2 bar to switch from blue to orange.
- Open a sell trade immediately after the color switch while the trend remains bearish.
- Place the stop loss just above the recent minor resistance or above the start of the new orange bar.
- Set the take profit between 7 and 30 pips or points.
- Exit early if a green Bykov arrow appears or the bar switches back to blue.
Cast Study 1
On the Boom 100 1-minute chart, the Bykov Trend HFT indicator showed a green arrow, confirming a bullish trend.
Shortly after, the Boom and Crash Gold Miner V2 bar switched from orange to blue, signaling a buy entry.
A trade was placed with the stop loss below a recent minor support.
Price moved upward quickly and reached 15 points, where a partial profit was taken.
The remaining position trailed the stop and closed near 22 points, demonstrating a fast and effective scalping setup.
Cast Study 2
On the Crash 100 5-minute chart, the Bykov Trend HFT indicator displayed a magenta arrow, confirming a bearish trend.
The Boom and Crash Gold Miner V2 bar then switched from blue to orange, triggering a sell trade.
The stop loss was placed just above the nearest minor resistance.
Price dropped rapidly and hit 12 points, with partial profit secured.
The remaining position followed the move downward and closed near 20 points, showing how aligning trend confirmation with fast entry signals works well on high-speed charts.
Download Now
Boom and Crash Gold Miner v2 Trend.ex5 Indicator (MT5)
FAQ
Can I use this indicator outside Boom and Crash markets?
While it is optimized for Boom and Crash indices, it can be tested on other volatile instruments. Performance may vary depending on market behavior.
Which time frame works best?
The indicator performs consistently across M5, M15, and H1 charts. Lower time frames suit scalpers, while higher time frames suit swing traders.
What settings should I adjust first?
Start by adjusting the trend period and deviation to match the volatility of your selected Boom or Crash index. Fine-tune trend power for faster or smoother signals.
Summary
The Boom and Crash Gold Miner v2 Trend Indicator for MT5 offers a practical way to trade trend shifts using color-based signals.
Its separate window display keeps the analysis straightforward and focused on momentum changes.
With adjustable parameters and compatibility across multiple time frames, it supports different trading styles.
Traders who follow color transitions with disciplined risk management can build a consistent trend-based approach around this tool.


