About the CCI Forex Signals Histogram Indicator
The CCI Forex Signals Histogram Indicator for MetaTrader 4 is a momentum-based trading tool derived from the Commodity Channel Index.
Instead of displaying a traditional CCI line, it converts CCI data into a dynamic histogram that reflects bullish and bearish market pressure in real time.
The indicator uses color changes to define trend direction.
Blue histogram bars represent bullish conditions, while red bars indicate bearish momentum.
This simplified display allows traders to focus on trend changes without analyzing numerical CCI values.
The default CCI period is set to 14, but many traders prefer increasing it to 50 to reduce market noise.
A higher period smooths the histogram and helps filter out weaker signals, especially on lower timeframes or volatile currency pairs.
Free Download
Download the “iCCI_Advanced_Histo_v1.0.ex4” MT4 indicator
Key Features
- CCI-based histogram buy and sell signals.
- Blue bars indicate bullish market direction.
- Red bars indicate bearish market direction.
- Real-time trend visualization.
- Adjustable CCI period settings.
- Works on all MT4 currency pairs and timeframes.
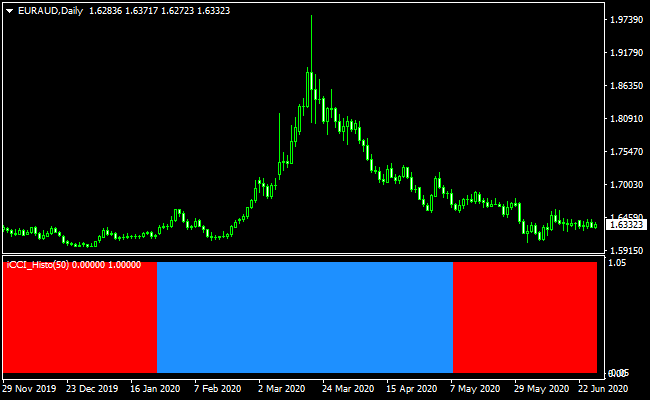
Indicator Chart
The chart below shows the CCI Forex Signals Histogram Indicator applied to a forex chart.
The histogram switches between blue and red as momentum changes.
These color shifts help traders identify trend transitions and manage entries and exits more effectively.

Guide to Trade with CCI Forex Signals Histogram Indicator
Buy Rules
- The histogram changes color from red to blue.
- The market shows increasing bullish momentum.
- Enter the trade at the beginning of the blue histogram phase.
Sell Rules
- The histogram changes color from blue to red.
- The market shows increasing bearish momentum.
- Enter the trade at the beginning of the red histogram phase.
Stop Loss
- Place the stop loss below the nearest support for buy trades.
- Place the stop loss above the nearest resistance for sell trades.
- Volatility-based stop loss methods may also be applied.
Take Profit
- Close the trade when the histogram changes to the opposite color.
- Use a fixed profit target based on the trading timeframe.
- Partial exits can be used during strong momentum moves.
CCI Signals + Waddah Attar Forex Scalping Strategy for MT4
This MT4 strategy combines the strength of the CCI Forex Signals Histogram and the Waddah Attar Scalping Indicator.
Together, they form a fast and reactive setup that suits traders who focus on short-term momentum shifts.
The CCI histogram shows the overall trend direction. A blue histogram indicates a bullish trend, while a red histogram signals bearish momentum.
The Waddah Attar indicator confirms the entry. A green histogram means a buy opportunity, and a red histogram means a sell opportunity.
This method works best on the M1 and M5 time frames. It is designed for active scalpers who prefer quick trades with well-defined entry and exit rules.
The strategy works because both indicators react rapidly to changes in price pressure. When they line up, momentum usually accelerates for several candles.
Buy Entry Rules
- The CCI Histogram must be blue to confirm a bullish trend.
- Waddah Attar Histogram must turn green to generate the buy signal.
- Enter as soon as both conditions appear on the same candle.
- Stop loss below the previous swing low.
- Take profit 8–12 pips on M1 charts and 15–25 pips on M5 charts.
Sell Entry Rules
- The CCI Histogram must be red to confirm a bearish trend.
- Waddah Attar Histogram must turn red to generate the sell signal.
- Enter the moment both indicators align.
- Stop loss above the previous swing high.
- Take profit 8–12 pips on M1 and 15–25 pips on M5 charts.
Advantages
- Clear visual confirmation with color-coded trend signals.
- Fast entries are ideal for short-term scalping.
- Works well on volatile currency pairs.
- Simple rules that can be applied consistently.
- Both indicators reduce hesitation by showing momentum strength.
Drawbacks
- Requires fast execution on M1 charts.
- Not suited for traders who dislike rapid market changes.
Example Case Study 1: EURUSD M1
During a London session breakout, the CCI Histogram turned blue after a short consolidation.
Two candles later, the Waddah Attar Histogram printed a strong green bar.
A buy entry was triggered immediately.
The stop loss was placed below the minor pullback.
Momentum increased quickly, and the price moved 14 pips within minutes.
The trade hit take profit without any retracement, showing how well the two indicators align during active market periods.
Example Case Study 2: GBPUSD M5
Later in the New York session, GBPUSD shifted into a downtrend.
The CCI Histogram changed to red first, showing early weakness.
Shortly after, the Waddah Attar Histogram printed a solid red bar, confirming the sell signal.
The entry was taken at the close of the candle.
The pair dropped steadily and produced a clean 22-pip move before slowing down.
The take profit target was reached while maintaining a favorable risk-to-reward ratio.
Strategy Tips
- Avoid trading when both histograms switch colors back and forth.
- Best results occur during the London and New York sessions.
- Use major pairs such as EURUSD, GBPUSD, or XAUUSD for stronger momentum.
- Do not chase late entries. Only take signals when both colors align instantly.
- Keep spreads in mind, especially when trading M1 charts.
- Stay out of the market during high-impact news releases.
Download Now
Download the “iCCI_Advanced_Histo_v1.0.ex4” Metatrader 4 indicator
FAQ
Why adjust the CCI period from 14 to 50?
Using a higher CCI period smooths the histogram and reduces the number of weak or short-lived signals, especially during ranging markets.
Is this indicator suitable for trend trading?
Yes, the histogram format makes it effective for following medium to long-term trends when applied to higher timeframes.
Can this indicator be combined with other tools?
It pairs well with support and resistance, moving averages, or higher timeframe trend confirmation for stronger setups.
Summary
The CCI Forex Signals Histogram Indicator for MT4 offers a practical way to trade momentum using a clean, color-based display.
Transforming CCI data into a histogram simplifies trend recognition and decision-making.
With adjustable settings and compatibility across all currency pairs and timeframes, the indicator adapts well to different trading styles.


