
About the Daily Data Forex Indicator
The Daily Data Indicator for MT5 is a versatile tool that displays essential market information in a compact mini dashboard.
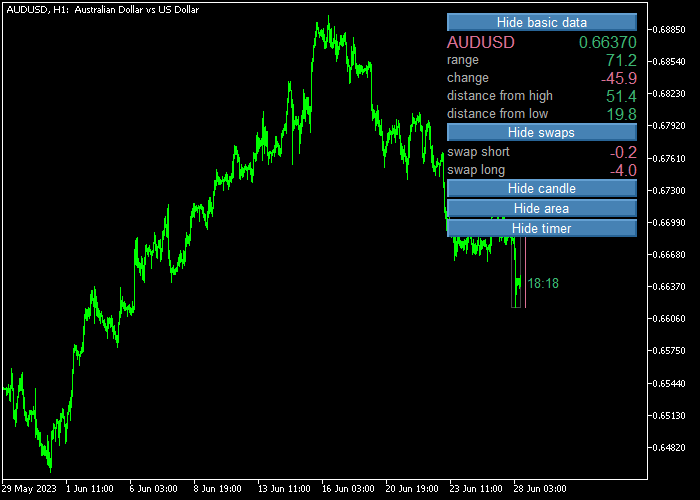
It shows currency pair details, trading ranges, pip changes, distances from daily highs and lows, swaps, and a timer, all in one glance.
This indicator is ideal for traders who want a clear snapshot of market conditions without cluttering the chart.
All data is presented in real time, helping traders monitor price movements and assess volatility throughout the trading day.
You can customize the dashboard with different text colors, background colors, label colors, symbol colors, font size, position, and corner placement to fit your preferred chart layout.
Free Download
Key Features
- Displays currency pair name, trading range, pip change, and distances from daily high/low.
- Shows swap values for long and short positions and includes a countdown timer.
- Compact mini dashboard format keeps your main chart clean.
- Fully customizable: text, background, labels, symbols, font size, position, and corner.
- Provides real-time market data for smarter trading decisions.
- Supports all Forex pairs and works on multiple timeframes.
Indicator Chart
The Daily Data Indicator appears as a mini dashboard directly on the price chart.
It shows all relevant market data in one panel, including trading range, pip change, distance from daily highs and lows, swaps, and a timer.
Traders can quickly assess market conditions at a glance without additional calculations.
Guide to Trade with Daily Data Forex Indicator
Buy Rules
- Use the indicator to identify pairs with price near the daily low for potential bullish setups.
- Combine with trend indicators or support levels to confirm upward momentum.
- Open a buy trade when other technical indicators align with a bullish bias.
- Avoid buying if the pair is already close to the daily high or overextended.
Sell Rules
- Use the indicator to identify pairs with price near the daily high for potential bearish setups.
- Combine with trend indicators or resistance levels to confirm downward momentum.
- Open a sell trade when other technical indicators align with a bearish bias.
- Avoid selling if the pair is already close to the daily low or oversold.
Stop Loss
- For buy trades, place the stop loss slightly below the nearest support or daily low level.
- For sell trades, place the stop loss slightly above the nearest resistance or daily high level.
Take Profit
- Close buy trades when the price approaches the daily high or another strong resistance level.
- Close sell trades when the price approaches the daily low or another strong support level.
Daily Data MT5 Strategy with EMA Trend Catcher Indicator
This trading strategy combines the Daily Data Forex Indicator with the EMA Trend Catcher Forex Indicator to create a structured approach to day trading and short-term swing opportunities.
The Daily Data tool provides a compact overview of market conditions such as range, pip movement, and distance from highs and lows, helping traders quickly understand the current environment.
The EMA Trend Catcher complements this by giving clear directional signals through arrow markers.
By combining market context with precise entry signals, traders can avoid random trades and focus on setups that align with both momentum and structure.
This strategy works best on M15, M30, and H1 charts.
It is suitable for traders who want a balanced approach between quick trades and slightly longer holds during strong intraday trends.
Buy Entry Rules
- Use the Daily Data Indicator to confirm bullish conditions such as rising daily range or price trading closer to daily highs.
- Wait for a blue arrow from the EMA Trend Catcher, indicating a buy signal.
- Enter a buy trade at the close of the signal candle.
- Place the stop loss below the recent swing low or below a nearby daily level.
- Close the trade when a red arrow appears or when price approaches the daily high zone.
Sell Entry Rules
- Use the Daily Data Indicator to confirm bearish conditions such as falling momentum or price moving closer to daily lows.
- Wait for a red arrow from the EMA Trend Catcher, indicating a sell signal.
- Enter a sell trade at the close of the signal candle.
- Place the stop loss above the recent swing high or above a nearby daily level.
- Close the trade when a blue arrow appears or when price nears the daily low zone.
Case Study 1: USDJPY M30
On the USDJPY M30 chart, the Daily Data Indicator showed strong upward movement with price pushing closer to the daily high.
This suggested bullish intraday pressure.
Shortly after, a blue arrow appeared from the EMA Trend Catcher, confirming the buy setup.
A trade was entered at the close of the signal candle with the stop loss placed below the recent swing low.
Price continued to climb steadily as momentum held.
The trade was closed near the daily high zone when a red arrow appeared.
Case Study 2: NZDUSD H1
On the NZDUSD H1 chart, the Daily Data Indicator showed price drifting toward the daily low with weakening bullish movement.
This indicated a shift toward bearish conditions.
A red arrow then appeared from the EMA Trend Catcher, confirming a sell opportunity.
A sell trade was opened at the close of the signal candle with the stop loss above the recent swing high.
Price moved downward with consistent pressure.
The position was closed for 37 pips as price approached the daily low area and a blue arrow began to form, locking in profit from the move.
Download Now
FAQ
Does the Daily Data Indicator generate buy or sell signals?
No. It only displays real-time market data. Trades should be based on additional technical indicators or analysis.
Can I customize the dashboard display?
Yes. You can adjust text colors, background, symbols, labels, font size, position, and corner placement to suit your chart layout.
Is it suitable for all Forex pairs?
Yes. The indicator supports all MT5 Forex pairs and can be used on multiple timeframes.
How does it help my trading?
It provides a quick overview of daily price movement, pip changes, and swaps, allowing traders to make informed decisions and identify potential entry and exit zones.
Summary
The Daily Data Forex Indicator provides traders with a compact, real-time dashboard of key market metrics, including trading ranges, daily highs and lows, pip changes, swaps, and countdown timers.
It enhances market awareness and can be combined with trend-following or support/resistance tools to improve trade timing.
Customization options allow traders to seamlessly integrate the dashboard into any chart layout for daily analysis.


