About the Daily Lines Forex Indicator
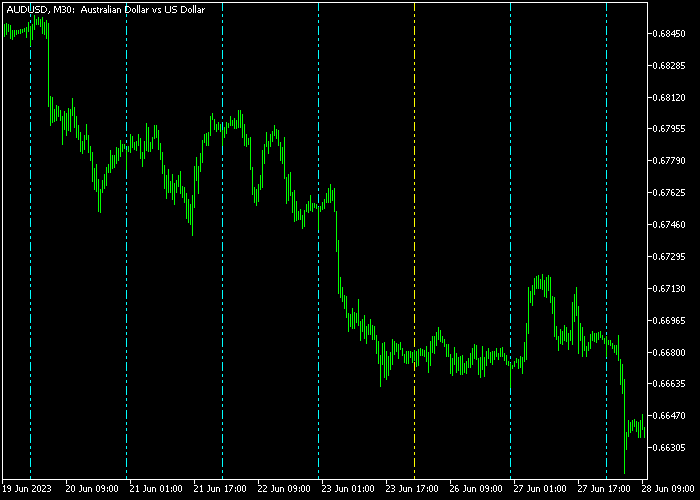
The Daily Lines Forex Indicator for MT5 helps traders monitor daily market behavior by displaying Monday through Friday as vertical dashed lines on the price chart.
This visual separation allows you to quickly analyze how trends develop over the trading week.
By tracking daily price movement, you can identify repeating patterns, opening ranges, and momentum shifts for each weekday.
The indicator supports customization of line colors, styles, text placement, fonts, and anchor positions to match your trading preferences.
Free Download
dailylines.mq5 Indicator (MT5)
Key Features
- Displays daily vertical lines for Monday through Friday directly on the chart.
- Helps visualize trend progression over the trading week.
- Customizable weekdays colors, line styles, text placement, and font options.
- Supports all Forex pairs on the daily timeframe.
- Ideal for planning entry and exit points based on daily trends.
- Can be combined with other trend-following or support/resistance tools for higher accuracy.
Indicator Chart
The Daily Lines Indicator plots vertical dashed lines for each trading day directly on the price chart.
You can instantly see how the price behaves during each weekday and evaluate the strength or weakness of trends over multiple days.
This makes it easier to plan trades based on weekday-specific patterns and market rhythm.

Guide to Trade with the Daily Lines Forex Indicator
Buy Rules
- Identify upward momentum within the current weekday’s vertical section.
- Open a buy trade when the price shows a strong daily trend moving higher.
- Confirm the entry with additional trend indicators or support levels.
- Avoid entering if the price is near strong resistance within the daily range.
Sell Rules
- Identify downward momentum within the current weekday’s vertical section.
- Open a sell trade when the price shows a clear daily downtrend.
- Confirm the entry with additional trend indicators or resistance levels.
- Avoid selling near strong support within the daily range.
Stop Loss
- For buy trades, place the stop loss below the low of the current weekday’s range.
- For sell trades, place the stop loss above the high of the current weekday’s range.
Take Profit
- Close buy trades when price approaches the upper boundary of the current weekday’s range.
- Close sell trades when price approaches the lower boundary of the current weekday’s range.
Daily Lines Swing Strategy for MT5 with Trend Hunter Indicator
This swing trading strategy combines the Daily Lines Forex Indicator with the Trend Hunter Forex Indicator to capture multi-day price moves with strong directional bias.
The Daily Lines tool helps identify upward and downward momentum within the current weekday section, while the Trend Hunter confirms entries with clear arrow signals.
This combination allows traders to align with broader momentum while entering at optimal points.
This strategy works best on H1, H4, and D1 charts.
It fits traders who prefer holding trades longer than intraday setups and want to follow sustained market trends with clear confirmation.
Buy Entry Rules
- Identify upward momentum within the current weekday section using the Daily Lines Indicator.
- Wait for a blue Trend Hunter arrow to appear, confirming a buy signal.
- Enter a buy trade at the close of the signal candle.
- Place the stop loss below the most recent swing low or below a nearby Daily Lines level.
- Close the trade when a magenta arrow appears or when price shows clear rejection near resistance.
- You can also trail profits as the trend continues.
Sell Entry Rules
- Identify downward momentum within the current weekday section using the Daily Lines Indicator.
- Wait for a magenta Trend Hunter arrow to appear, confirming a sell signal.
- Enter a sell trade at the close of the signal candle.
- Place the stop loss above the most recent swing high or above a nearby Daily Lines level.
- Close the trade when a blue arrow appears or when price reacts strongly at support.
- You can also trail the position as the move develops.
Case Study 1: EURUSD H4
On the EURUSD H4 chart, the Daily Lines Indicator showed clear upward momentum during the midweek session.
Price respected the structure and continued forming higher highs within the weekday section.
Shortly after, a blue Trend Hunter arrow appeared, confirming the bullish direction.
A buy trade was opened at the close of the signal candle with the stop loss placed below the recent swing low.
Price continued trending upward over the next sessions.
The trade was managed by trailing the stop and was eventually closed when a magenta arrow appeared, securing a solid swing profit.
Case Study 2: AUDUSD H1
On the AUDUSD H1 chart, the Daily Lines Indicator highlighted downward momentum within the current weekday range.
Price consistently moved lower with minor pullbacks.
A magenta Trend Hunter arrow appeared during a retracement, confirming a continuation setup.
A sell trade was entered at the close of the signal candle with the stop loss placed above the recent high.
Price declined steadily as the bearish trend continued.
The position was closed when a blue arrow appeared, locking in gains from the extended move.
Download Now
dailylines.mq5 Indicator (MT5)
FAQ
Can I use the Daily Lines Indicator on intraday charts?
No. This indicator is designed specifically for the daily timeframe to track weekday trends accurately.
Can the colors and text be customized?
Yes. You can adjust line colors for each weekday, modify text placement, choose fonts, and select anchor positions to suit your chart layout.
Does it work with all Forex pairs?
Yes. The Daily Lines Indicator supports all currency pairs available on MT5.
How can it help my trading?
It allows you to visualize daily trend progression, plan entry and exit points, and combine weekday insights with other indicators for higher-confidence trades.
Summary
The Daily Lines Forex Indicator for MT5 provides clear daily visual separation, making it easy to monitor trends from Monday to Friday.
It helps traders identify strong weekday momentum, opening ranges, and potential price reversals.
Customizable lines, colors, and text options allow you to tailor the indicator to your chart preferences.
Used alongside trend confirmation tools, it can improve timing for buy and sell entries while helping manage stop loss and take profit levels based on the daily range.


