
About the Detrended Synthetic Price Oscillator Indicator
The Detrended Synthetic Price Oscillator indicator for MT5 converts price data into a trend-following tool that provides timely buy and sell signals.
Displayed as a red line in a separate sub-window, it shows positive values for bullish trends and negative values for bearish trends.
The indicator is suitable for scalping and day trading, helping traders quickly identify trend direction and potential entries by removing the noise of longer-term price cycles.
This technical tool is highly customizable, allowing adjustment of the half period MA and the moving average method.
Traders can use it as a standalone signal tool or combine it with other technical analysis methods for confirmation.
Free Download
Key Features
- Oscillates around a zero level to determine immediate shifts in market momentum.
- Utilizes detrending logic to isolate short-term cycles from the primary price trend.
- Allows for full adjustment of the calculation period to match various trading sessions.
Indicator Chart
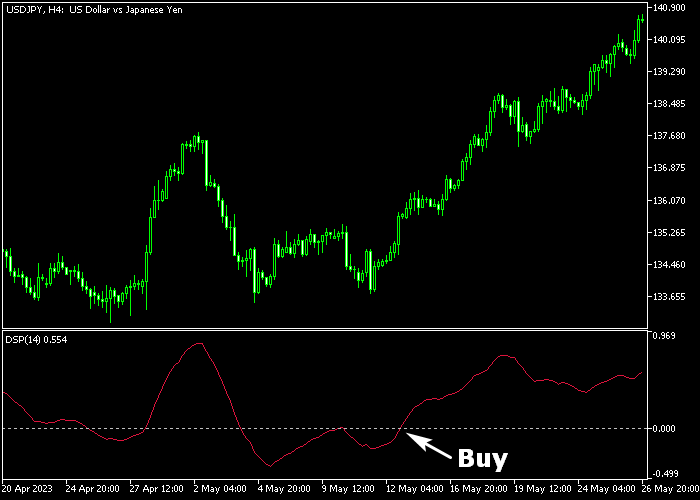
The chart displays the Detrended Synthetic Price Oscillator indicator plotted in the bottom window as a continuous red line.
When this line moves above the zero mark, the market sentiment is considered bullish, while movements below zero signal bearish pressure.
Traders watch for the precise moment the line crosses the center level to execute trades in the direction of the new price swing.
Guide to Trade with Detrended Synthetic Price Oscillator Indicator
Buy Rules
- A buy signal is created when the red line crosses the 0.00 level bottom up.
- Open a buy trade immediately once the oscillator line closes in the positive zone.
- Verify that the candle on the main chart shows a bullish rejection of lower prices.
- Maintain the position as long as the red line continues to climb above zero.
Sell Rules
- A sell signal is created when the red line crosses the 0.00 level top down.
- Open a sell trade once the red line breaks and closes below the zero level.
- Look for a bearish candle confirmation on the price chart to support the signal.
- Keep the trade active until the oscillator shows signs of crossing back above zero.
Stop Loss
- Place your stop loss order below the most recent swing low for buy entries.
- Set the stop loss above the most recent swing high for all sell positions.
- Adjust the stop loss to breakeven once the price moves in your favor significantly.
Take Profit
- Exit the trade for a risk to reward ratio of at least 1.5 or higher.
- Liquidate the position as soon as a reversal signal appears in the opposite direction.
- Target the next major support or resistance zone for a fixed profit objective.
Detrended Synthetic Price Oscillator and SMA MT5 Scalping Strategy
This scalping strategy combines the Detrended Synthetic Price Oscillator with the Simple Moving Average (SMA) to create a fast and reactive trading system.
It is designed to capture short momentum bursts while staying aligned with the overall intraday trend.
The Detrended Synthetic Price Oscillator removes long term trend influence and highlights short term price swings.
A cross above the zero level signals a potential bullish shift, while a cross below zero indicates bearish momentum.
This makes it useful for spotting early reversals and scalping opportunities.
The SMA then acts as a directional filter, helping traders stay on the correct side of the market by defining bullish or bearish structure.
This strategy works best on M1 to M5 timeframes and is suitable for highly liquid forex pairs such as EURUSD, GBPUSD, USDJPY, AUDUSD, and EURJPY during London and New York sessions.
Buy Entry Rules
- Wait for the Detrended Synthetic Price Oscillator to cross above the zero level from below.
- Confirm that price is trading above the SMA line, which should be blue to indicate a bullish trend.
- Enter a buy trade immediately after the signal candle closes above the SMA.
- Place the stop loss below the most recent micro swing low or just under the SMA depending on volatility.
- Take profit when the oscillator crosses back below zero or when price closes below the SMA.
Sell Entry Rules
- Wait for the Detrended Synthetic Price Oscillator to cross below the zero level from above.
- Confirm that price is trading below the SMA line, which should be orange to indicate a bearish trend.
- Enter a sell trade after the signal candle closes below the SMA.
- Place the stop loss above the most recent swing high or just above the SMA depending on market movement.
- Take profit when the oscillator crosses back above zero or when price closes above the SMA.
Case Study 1: EURUSD M1 Scalping Buy Setup
During the London open on EURUSD M1, price was moving sideways just below the SMA, which was sloping slightly upward but not yet strongly directional.
The Detrended Synthetic Price Oscillator then crossed above the zero line, showing the first sign of bullish momentum returning to the market.
At the same time price pushed above the SMA, confirming that bullish structure was forming.
A buy trade was entered at the close of the signal candle after the breakout above the moving average.
The stop loss was placed just under the SMA rather than the recent swing low, keeping risk tight for a scalping environment.
Price moved quickly upward in short bursts, respecting the SMA as dynamic support.
The buy trade was closed exactly when the oscillator crossed back below the zero line, signaling that bullish momentum had fully faded.
Case Study 2: USDJPY M5 Scalping Sell Setup
On USDJPY M5 during the New York session, price had been ranging near the SMA before a sudden shift in momentum.
The Detrended Synthetic Price Oscillator crossed below the zero level, indicating a transition into bearish pressure.
Shortly after, price closed below the SMA, which had turned orange and started to slope downward.
A sell trade was entered at the close of that candle following a small pullback into the SMA area.
The stop loss was placed above the SMA rather than the recent swing high, allowing the setup to remain responsive to fast market movement.
Price continued downward in a controlled move, staying below the SMA for most of the trend.
The short trade was closed precisely when the oscillator crossed back above zero and a bullish candle closed above the SMA, confirming a full momentum reversal.
Download Now
FAQ
How does the half period MA setting affect the oscillator sensitivity?
The half period MA determines how many bars are used for the calculation.
A smaller number makes the red line move faster and generate more signals, while a larger number smooths the line for longer trades.
Why is this indicator recommended for London and New York sessions?
These sessions have the highest volume, which allows the oscillator to track price cycles more effectively.
In low-volume sessions, the line may produce false signals due to choppy price action.
Can I change the applied price for the calculation?
Yes, the indicator allows you to choose from various price inputs such as close, open, high, or low.
Most traders stick to the close price to ensure the signal is confirmed by the end of the candle.
Summary
The Detrended Synthetic Price Oscillator indicator provides a streamlined approach to technical analysis by merging trend detection with momentum filtering.
It allows traders to navigate different market conditions by visually separating bullish impulses from bearish pressure.
Because the signals do not repaint, the tool remains a reliable choice for those executing fast-paced strategies like scalping or day trading.
Its ability to isolate short-term cycles ensures that traders are entering the market at the most opportunistic moments.


