

About the Dynamic Balance Point with Support and Resistance Indicator
The Dynamic Balance Point with Support and Resistance indicator for MT5 is a trend-based trading tool that generates buy and sell signals using dynamic support and resistance calculations.
It plots a dual-colored signal line directly on the price area, allowing traders to quickly determine whether the market is in a bullish or bearish phase.
A blue line indicates that the market is moving in a bullish trend, while a brown line signals a bearish phase.
Traders can also adjust several parameters including the balance point period, timeframe selection, colors, and line style to match their preferred trading approach.
Free Download
Dynamic balance point – support and resistance.mq5 Indicator (MT5)
Key Features
- Plots a dynamic signal line based on support and resistance calculations.
- Uses two colors to represent bullish and bearish market conditions.
- The blue line signals an upward trend while the brown line signals a downward trend.
- Built-in multi-timeframe analysis for broader market perspective.
Indicator Chart
The Dynamic Balance Point with Support and Resistance Indicator appears on the main price area as a continuous signal line that changes color with market direction.
The example shows the blue line marking bullish phases and the brown line highlighting bearish momentum.
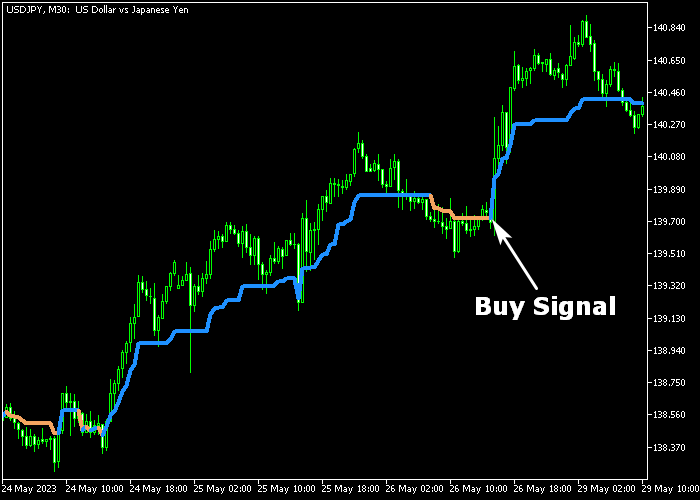
Guide to Trade with Dynamic Balance Point with Support and Resistance Indicator
Buy Rules
- Watch for the signal line to change from brown to blue.
- The beginning of the blue colored line signals bullish momentum.
- This color change suggests buyers are gaining control of the market.
- Open a buy position once the blue signal line begins.
Sell Rules
- Watch for the signal line to change from blue to brown.
- The beginning of the brown colored line signals bearish momentum.
- This shift indicates sellers are starting to dominate the market.
- Open a sell position when the brown signal line appears.
Stop Loss
- Place the stop loss 3 pips below the most recent swing low for buy trades.
- For sell trades, place the stop loss 3 pips above the most recent swing high.
- Traders can also tighten the stop as the trend progresses.
Take Profit
- Close the buy trade if the signal line changes from blue to brown.
- Close the sell trade if the signal line switches from brown to blue.
- Alternatively, target the next strong support or resistance level.
Dynamic Balance Point and RSI Swings Day Trading Strategy for MT5
This strategy combines the Dynamic Balance Point with S/R Indicator and the RSI Swings Indicator to build a clear intraday trading system based on trend structure and momentum confirmation.
The Dynamic Balance Point indicator defines the market structure using a central balance level.
When price trades above the blue line, the market is considered bullish. When price trades below the brown line, the market is bearish.
This creates a stable directional bias before any trade is taken.
The RSI Swings indicator complements this by showing momentum shifts through histogram bars.
Green bars indicate bullish pressure and potential buy opportunities, while red bars signal bearish momentum and potential sell conditions.
The combination helps avoid weak entries by waiting for both structure and momentum alignment.
This strategy works best on M5 and M15 timeframes and is suitable for major forex pairs such as EURUSD, GBPUSD, USDJPY, AUDUSD, and USDCAD during London and New York sessions.
Buy Entry Rules
- Wait for price to close above the blue Dynamic Balance Point line, confirming bullish market structure.
- Confirm that the RSI Swings indicator prints green histogram bars showing upward momentum.
- Enter a buy trade after a minor pullback while price remains above the blue line.
- Place the stop loss below the most recent swing low or below the balance line for tighter risk control.
- Take profit at the next resistance zone or when RSI Swings prints a red histogram bar.
Sell Entry Rules
- Wait for price to close below the brown Dynamic Balance Point line, confirming bearish structure.
- Confirm that the RSI Swings indicator prints red histogram bars showing downward momentum.
- Enter a sell trade after a small retracement while price stays below the brown line.
- Place the stop loss above the most recent swing high or above the balance line depending on volatility.
- Take profit at the next support zone or when RSI Swings prints a green histogram bar.
Case Study 1: EURUSD M5 Bullish Continuation
During the London session on EURUSD M5, price moved above the Dynamic Balance Point blue line and stayed there after a brief consolidation.
This confirmed a bullish environment with buyers in control.
Shortly after, the RSI Swings indicator began printing green histogram bars, confirming momentum alignment with the bullish structure.
A buy trade was entered after a small pullback to the balance line area.
The stop loss was placed just below the balance line rather than the swing low, giving the trade enough room to handle minor volatility.
Price then continued upward with consistent green histogram bars supporting the move.
The trade was closed exactly when the RSI Swings indicator changed from green to red histogram bars while price also closed back below the Dynamic Balance Point blue line.
This confirmed that bullish momentum had ended and the structure had shifted.
Case Study 2: GBPJPY M15 Bearish Reversal
On GBPJPY M15 during the New York session, price dropped below the Dynamic Balance Point brown line after failing to hold above it.
This marked a transition into bearish market structure.
The RSI Swings indicator then printed strong red histogram bars, confirming downward momentum.
A sell trade was entered after a minor retracement toward the balance line area, with price still staying below it.
The stop loss was placed above the most recent swing high instead of the balance line, allowing the trade to survive small intraday spikes.
Price then moved lower in a steady sequence of red histogram bars.
The trade was closed precisely when a green histogram bar appeared and price closed back above the Dynamic Balance Point brown line.
This confirmed a full momentum shift and invalidated the bearish continuation.
Download Now
Dynamic balance point – support and resistance.mq5 Indicator (MT5)
FAQ
Is the Dynamic Balance Point indicator multi-timeframe?
Yes. The indicator includes built-in multi-timeframe functionality.
This allows traders to analyze signals derived from higher timeframe data while trading on a lower timeframe.
Can this indicator be used as a standalone strategy?
Yes. Some traders use the color changes of the signal line as their primary trading signals.
Others combine it with additional tools such as moving averages or price action analysis.
Summary
The Dynamic Balance Point with Support and Resistance Indicator helps traders follow market direction using a simple color-changing signal line.
The blue line signals bullish conditions, while the brown line highlights bearish momentum.
Its multi-timeframe calculation and customizable settings make it adaptable to many trading styles.
When combined with price action or other indicators, it can help traders identify reliable trend-based trading opportunities.





