
About the Kalman Bands Indicator
The Kalman Bands Indicator for MT5 is a volatility-based tool that helps traders identify market trends and potential entry or exit points.
By measuring price deviation through adaptive bands, it highlights periods of expansion and contraction in the market.
Wide bands indicate high volatility, while narrow bands reflect low volatility.
The slope of the bands indicates trend direction: an upward slope signals bullish conditions, and a downward slope signals bearish conditions.
The indicator is highly customizable, allowing traders to adjust price type, filter order, fast filter period, smoothing period, pre-smoothing MA mode, and the Sigma multiplier.
Free Download
Kalman bands.mq5 Indicator (MT5)
Key Features
- Measures market volatility using adaptive upper and lower bands.
- Sloping bands indicate trend direction.
- Signals potential trade entries and exits based on band touches.
- Fully adjustable parameters for different trading styles.
- Suitable for scalping, intraday, and swing strategies.
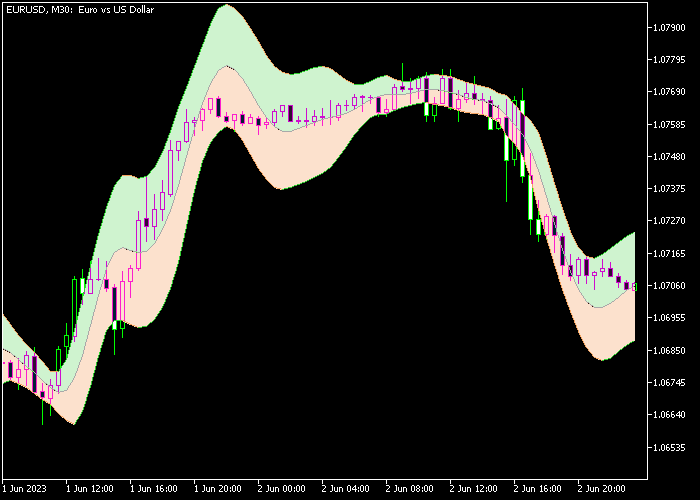
Indicator Chart
The Kalman Bands Indicator appears directly on the price chart as two colored bands: orange on the lower band and green on the upper band.
Price interacting with these bands combined with band slope signals potential trend continuation or reversal.
The bands expand during high volatility and contract during consolidation.
Guide to Trade with Kalman Bands Indicator
Buy Rules
- Wait for the candle to touch the lower orange band from above while the bands slope upwards.
- Confirm the candle shows rejection at the lower band.
- Open a buy position at the next candle open.
- Stay in the trade until price reaches the upper green band.
Sell Rules
- Wait for the candle to touch the upper green band from below while the bands slope downwards.
- Confirm the candle shows rejection at the upper band.
- Open a sell position at the next candle open.
- Stay in the trade until price reaches the lower orange band.
Stop Loss
- For buy trades, place the stop below the lower orange band.
- For sell trades, place the stop above the upper green band.
- Adjust position size according to the width of the bands.
Take Profit
- Close buy trades when price touches the upper green band.
- Close sell trades when price touches the lower orange band.
- Partial exits can be taken at mid-band levels during strong trends.
- Optionally, trail stops along the bands to capture extended moves.
MT5 Kalman Bands Scalping Strategy with Super Signals Indicator
This scalping strategy combines the Kalman Bands Indicator for MT5 with the Super Signals Indicator for MT5 to capture fast intraday momentum moves with trend confirmation and precise entry timing.
It is designed for M1 and M5 charts where price reacts quickly to volatility changes, especially during the London and New York sessions when market direction is clearer and liquidity is higher.
The Kalman Bands Indicator defines the market direction through band movement.
Rising bands indicate bullish conditions while declining bands indicate bearish pressure.
This provides a smooth view of trend direction and helps filter out choppy price behavior.
The Super Signals Indicator confirms entries using arrows.
A blue arrow signals a buy opportunity while a magenta arrow signals a sell setup.
When both indicators align, scalping opportunities become more reliable and structured.
Buy Entry Rules
- Wait for the Kalman Bands to turn upward and confirm rising structure, showing bullish trend direction.
- Confirm that a blue arrow appears from the Super Signals Indicator, signaling buy momentum.
- Enter a buy trade at the open of the next candle after both conditions align.
- Place stop loss below the most recent swing low or below the lower Kalman Band.
- Take profit at the next short-term resistance level or close the trade when a magenta arrow appears or the Kalman Bands start flattening or turning downward.
Sell Entry Rules
- Wait for the Kalman Bands to turn downward and confirm bearish structure in the market.
- Confirm that a magenta arrow appears from the Super Signals Indicator, signaling sell momentum.
- Enter a sell trade at the next candle open after confirmation.
- Place stop loss above the most recent swing high or above the upper Kalman Band.
- Take profit at the next support level or close the trade when a blue arrow appears or the Kalman Bands start turning upward, indicating a shift in trend direction.
Case Study 1: EURUSD Scalping Trade (M5, London Session)
EURUSD developed a steady upward structure during the London session as the Kalman Bands began rising after a short consolidation phase.
Price respected the lower band and continued pushing higher.
A blue arrow from the Super Signals Indicator appeared shortly after the trend confirmation.
A buy trade was executed at the next candle open.
Price moved upward in a controlled intraday rally with clean momentum between the bands.
The long trade was closed when a magenta arrow printed near resistance and the Kalman Bands began flattening, signaling reduced bullish pressure.
Case Study 2: GBPJPY Scalping Trade (M1, New York Session)
GBPJPY showed strong bearish momentum during the New York session as the Kalman Bands turned downward after a rejection from a key intraday level.
Price stayed below the mid band and continued forming lower highs.
A magenta arrow from the Super Signals Indicator confirmed the sell setup.
A short trade was entered on the next candle.
Price dropped quickly in a sharp impulse move with strong volatility.
The short trade was closed when a blue arrow appeared and the Kalman Bands started curving upward, indicating a shift back toward bullish pressure.
Download Now
Kalman bands.mq5 Indicator (MT5)
FAQ
How do Kalman Bands differ from Bollinger Bands?
Kalman Bands adapt more smoothly to market changes and react faster to volatility shifts, reducing lag and false signals compared to standard Bollinger Bands.
Which settings work best for volatile pairs?
Lower smoothing periods and higher Sigma multipliers increase sensitivity. Adjust based on the pair’s volatility and trading timeframe.
Can the indicator be used for breakout strategies?
Yes, price breaking and closing outside the bands can indicate strong continuation moves, especially when aligned with the band slope.
Are the bands useful for trend identification?
Absolutely. The slope direction of the bands gives a clear visual cue of whether the market is trending upward or downward.
Summary
The Kalman Bands Indicator provides a dynamic approach to measuring market volatility and spotting trend opportunities.
Its adaptive bands make it easier to identify entries, exits, and trend direction.
By trading touches of the lower and upper bands within the slope context, traders can follow trends efficiently and capture volatility-based moves.
When used consistently with a trade plan, it serves as a reliable tool for both trend and range-oriented strategies.


