

About the McGinley Dynamic Moving Average Indicator
The McGinley Dynamic Moving Average Indicator for MT5 is an adaptive trend-following tool designed to track price more efficiently than traditional moving averages.
It automatically adjusts its speed based on market conditions, helping it stay closer to price during fast markets and smoother during slower phases.
On the chart, it appears as a green line plotted directly on the main price area.
Its dynamic calculation reduces lag and reacts naturally to changes in volatility.
This makes it effective for identifying the dominant Forex trend in real time.
When price trades above the McGinley line, market conditions are considered bullish.
When price trades below it, the environment turns bearish.
Traders can modify the smoothing parameter, color, and line style to align with their chart setup.
Free Download
McGinley_Dynamic.mq5 Indicator (MT5)
Key Features
- An adaptive moving average that responds to market speed.
- Displayed as a green trend line on the main price area.
- Provides direct bullish and bearish bias signals.
- Customizable smoothing parameter.
- Suitable for intraday and swing trading strategies.
Indicator Chart
The McGinley Dynamic Moving Average Indicator is plotted directly over the price as a smooth green line.
When candles remain above the line, the trend holds bullish momentum. When candles stay below it, bearish pressure dominates.
Crosses of price through the line often signal potential trade opportunities or reversals.
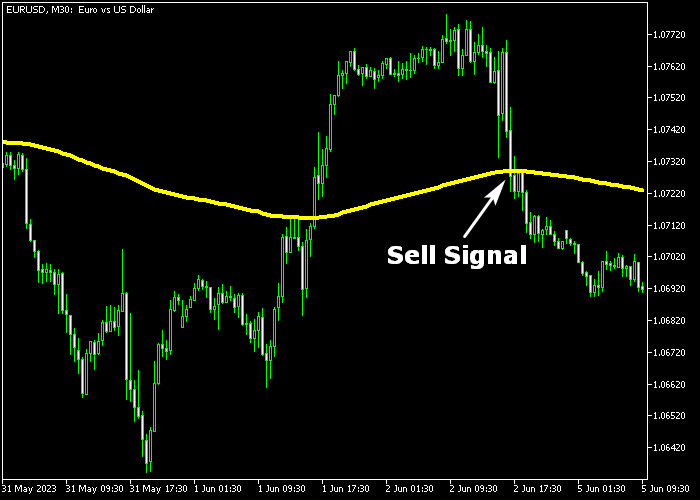
Guide to Trade with McGinley Dynamic Moving Average Indicator
Buy Rules
- Wait for a candle to close above the McGinley Dynamic line.
- Ensure the close is decisive and not a minor spike.
- Open a long position at the start of the next candle.
- Stay in the trade while candles continue closing above the line.
Sell Rules
- Wait for a candle to close below the McGinley Dynamic line.
- Ensure the break is supported by steady downward movement.
- Open a short position at the start of the next candle.
- Stay in the trade while candles continue closing below the line.
Stop Loss
- For buy trades, place the stop 3 pips below a recent support zone.
- For sell trades, place the stop 3 pips above a recent resistance zone.
- Position the stop beyond the latest swing extreme.
Take Profit
- Close buy trades when the candle closes back below the dynamic line.
- Close sell trades when the candle closes back above the dynamic line.
- Secure profits near previous swing highs or lows.
- Trail the stop along the moving average during strong trends.
McGinley Dynamic MA Day Trading Strategy for MT5
This day trading strategy combines the McGinley Dynamic Moving Average Indicator for MT5 with the Squeeze Candles Indicator for MT5 to capture intraday momentum moves with clear trend direction and precise timing.
The McGinley Dynamic Moving Average acts as the main trend filter.
The Squeeze Candles Indicator provides timing signals based on volatility expansion. Green candles indicate buy pressure while red candles indicate sell pressure.
It is designed for traders who prefer clean trend-based entries on M5 and M15 charts where price reacts quickly to volatility expansion after consolidation phases.
The strategy works best during London and New York sessions when market movement becomes more directional and predictable.
Buy Entry Rules
- Wait for a candle to close above the McGinley Dynamic Moving Average to confirm bullish trend direction.
- Confirm that the next candles from the Squeeze Candles Indicator print green bars, showing bullish momentum expansion.
- Enter a buy trade at the open of the next candle after confirmation.
- Place stop loss below the most recent swing low or below the McGinley Dynamic Moving Average.
- Take profit at the next resistance level or close the trade when Squeeze Candles turn red, indicating a shift in momentum.
Sell Entry Rules
- Wait for a candle to close below the McGinley Dynamic Moving Average to confirm bearish trend direction.
- Confirm that the Squeeze Candles Indicator prints red bars, showing bearish momentum expansion.
- Enter a sell trade at the open of the next candle after confirmation.
- Place stop loss above the most recent swing high or above the McGinley Dynamic Moving Average.
- Take profit at the next support level or close the trade when Squeeze Candles turn green, signaling bullish pressure returning.
Case Study 1
On EURUSD M15 during the London session, price closed above the McGinley Dynamic Moving Average after a short consolidation phase.
This confirmed a valid shift into bullish trend conditions.
Following the breakout, Squeeze Candles printed consecutive green bars showing strong momentum expansion.
A buy trade was entered at the next candle open.
Price continued moving upward with steady structure and higher highs.
The trade was closed when Squeeze Candles turned red near resistance, showing a loss of bullish momentum and early exhaustion of the move.
Case Study 2
On GBPJPY M5 during the New York session, price closed below the McGinley Dynamic Moving Average after a failed recovery attempt.
This confirmed a bearish market structure.
Squeeze Candles then printed strong red bars indicating downside momentum expansion.
A sell trade was taken at the next candle open.
Price dropped quickly in a clean intraday impulse and continued lower across several candles.
The short trade was closed when Squeeze Candles turned green and price started retesting the McGinley line, signaling a shift in short-term pressure.
Download Now
McGinley_Dynamic.mq5 Indicator (MT5)
FAQ
What makes the McGinley Dynamic different from a simple moving average?
The McGinley Dynamic adjusts automatically to changes in market speed.
This reduces lag and keeps the line closer to price during fast trends.
What does the smoothing parameter control?
The smoothing parameter influences how tightly the line follows price.
A lower value increases sensitivity, while a higher value produces a smoother curve.
Can the indicator be used on lower timeframes?
Yes, it adapts well to lower timeframes. Many traders apply it to M5 or M15 charts during active trading sessions.
Is it suitable for ranging markets?
Like most trend tools, it performs best in directional markets.
During sideways conditions, price may cross the line frequently and generate mixed signals.
Summary
The McGinley Dynamic Moving Average Indicator provides an adaptive way to follow market direction.
Its automatic adjustment helps reduce lag and keeps traders aligned with the prevailing trend.
By focusing on candle closes above or below the line, traders can build straightforward entry and exit rules.
Paired with a clear trade plan and consistent execution, it becomes a dependable tool for trend-based strategies.





