
About the MACD Crossover Signal Indicator
The MACD Crossover Signal Indicator for MetaTrader 4 is designed to simplify classic MACD analysis by converting histogram movements into direct buy and sell arrows.
Instead of manually analyzing MACD lines and histogram bars, traders receive visual signals whenever momentum shifts around the zero level.
The indicator generates a buy arrow when the MACD histogram turns back above the 0.00 line and a sell arrow when it turns back below.
These moments often signal short-term changes in market pressure, making the indicator useful for timing entries during active trading sessions.
Because it focuses only on meaningful histogram crossovers, the MACD Crossover Signal Indicator avoids unnecessary noise.
This makes it suitable for traders who prefer a clean, rule-based approach and want to apply traditional MACD logic without added complexity.
Free Download
Download the “Macd crossover signal.mq4” indicator for MT4
Key Features
- Buy and sell arrows based on MACD histogram zero-line crossovers
- Simplified interpretation of classic MACD momentum
- Works well on lower and medium timeframes
- Suitable for intraday and short-term trading
- Helps reduce hesitation during fast market conditions
- Fully compatible with MetaTrader 4
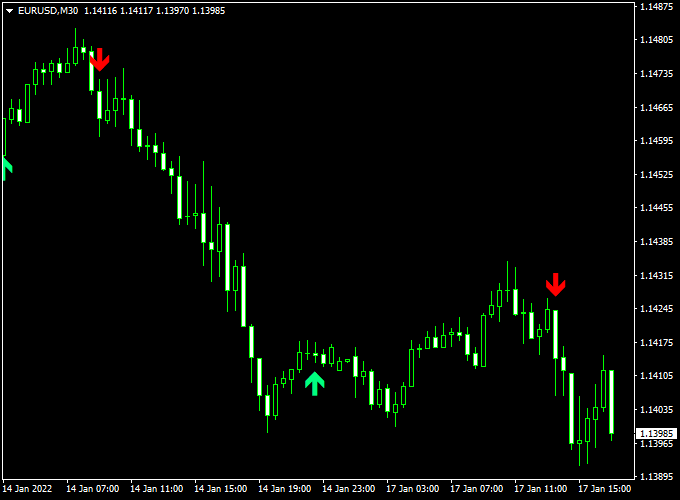
Indicator Chart
The chart below shows the MACD Crossover Signal Indicator applied to a price chart.
Green arrows mark potential buy opportunities when bullish momentum returns, while red arrows highlight sell setups as bearish momentum increases.
The signals help traders align entries with short-term momentum direction.
Guide to Trade with MACD Crossover Signal Indicator
Buy Rules
- Wait until a green arrow is printed after the histogram moves back above the zero line
- Check that the price is making higher closes or holding above the recent intraday support
Sell Rules
- Wait until a red arrow appears after the histogram turns back below the zero line
- Confirm price is failing to push higher or is reacting from intraday resistance
Stop Loss
- Place a stop loss beyond the high or low of the signal candle
- For buy trades, set the stop loss below the signal candle’s low
- For sell trades, set the stop loss above the signal candle high
Take Profit
- Target recent intraday support or resistance levels
- Close the trade when an opposite arrow appears
- Secure profits earlier during slower market conditions
Practical Tips
- Use the indicator during the London and New York sessions
- Apply it to major currency pairs with steady volume
- Avoid trading directly into major news releases
- Combine with simple price action for better timing
MACD Crossover Signal + Trend Power Forex Day Trading Strategy
The MACD Crossover Signal + Trend Power MT4 strategy is designed for intraday traders who prefer structured setups with clear visual confirmations.
It combines the MACD Crossover Signal Indicator, which plots green arrows for buy signals and red arrows for sell signals, with the Trend Power Indicator, which uses a blue line for bullish trends and a red line for bearish trends.
When both align, traders can catch strong intraday momentum moves while filtering out noise.
This strategy works best on the M15 and H1 timeframes, ideal for London and New York sessions.
Buy Entry Rules
- Wait for the MACD Crossover Signal indicator to plot a green arrow, signaling a potential buy entry.
- Confirm that the Trend Power indicator line is blue, showing bullish market strength.
- Enter the buy trade at or slightly above the high of the candle where the signal appears.
- Set the stop loss a few pips below the recent swing low or below the signal candle’s low.
- Set take profit at 1.5 to 2 times your stop loss distance, or exit when a red arrow appears or the Trend Power line turns red.
Sell Entry Rules
- Wait for the MACD Crossover Signal indicator to print a red arrow, signaling a potential sell entry.
- Confirm that the Trend Power indicator line is red, indicating a bearish trend.
- Enter the sell trade at or slightly below the low of the signal candle.
- Place the stop loss a few pips above the recent swing high or above the signal candle’s high.
- Set take profit at 1.5 to 2 times your stop loss distance or exit when a green arrow appears or the Trend Power line turns blue.
Advantages
- Simple and visually clear trading signals suitable for all experience levels.
- Combines trend confirmation and momentum timing for better accuracy.
- Effective during volatile trading sessions like London and New York overlaps.
- Easy to manage trades using clear stop loss and exit signals.
Drawbacks
- Less effective during sideways or low-volatility markets.
- Trend confirmation can sometimes lag, resulting in later entries.
- Requires constant chart monitoring during active trading hours.
- Performance may vary across currency pairs and session conditions.
Case Study 1: EURUSD M15 Buy Example
At the start of the London session, the Trend Power indicator turned blue, signaling a bullish environment.
A few candles later, the MACD Crossover Signal plotted a green arrow at 1.0860.
A buy trade was entered at 1.0862 with a stop loss at 1.0842 (20 pips) and a take profit at 1.0892 (30 pips).
Within an hour, the price reached the target, netting a +30 pip gain.
The clear alignment between both indicators provided strong confirmation and confidence in the trade.
Case Study 2: GBPUSD H1 Sell Example
During the New York session, the Trend Power line switched to red, showing bearish strength.
Shortly after, the MACD Crossover Signal indicator displayed a red arrow at 1.2625.
A sell trade was placed at 1.2620 with a stop loss at 1.2640 (20 pips) and take profit at 1.2590 (30 pips).
Price moved steadily downward, hitting the take profit target for a clean +30 pip win.
The combination of directional trend and momentum signal produced a high-quality entry.
Strategy Tips
- Focus on major currency pairs like EURUSD, GBPUSD, and USDJPY for consistent liquidity.
- Avoid trading before major news announcements to prevent sudden volatility spikes.
- Use this strategy during active market sessions for the best momentum results.
- If the Trend Power line frequently switches colors, skip trades as it indicates weak or choppy trends.
- Always backtest and forward-test before using the strategy on a live account.
Download Now
Download the “Macd crossover signal.mq4” indicator for Metatrader 4
FAQ
What exactly triggers a signal on this indicator?
A signal is triggered when the MACD histogram changes direction and crosses the zero level.
This indicates a shift in momentum rather than a continuation move.
Is this indicator better suited for trending or ranging markets?
It performs best when the market shows directional intent on an intraday level.
In tight ranges, histogram flips can occur more frequently and should be filtered with session timing.
Can the indicator be used on multiple pairs at the same time?
Yes. Because it relies on standard MACD logic, it behaves consistently across most currency pairs, especially those with steady volume during active sessions.
Should trades be taken immediately when an arrow appears?
Most traders wait for the candle to close before entering.
This helps avoid false signals caused by temporary price spikes around the zero line.
Summary
The MACD Crossover Signal Indicator is a free MT4 Forex indicator that converts MACD histogram zero-line movements into practical trading signals.
By focusing on momentum shifts rather than continuous oscillation, it helps traders spot entry points without overanalyzing the chart.
Its simple arrow-based signals make it suitable for intraday trading across different timeframes.


