
About the MTF Support & Resistance indicator
The MTF Support & Resistance indicator for MT5 is a powerful technical tool designed to simplify multi-timeframe analysis by projecting key price levels directly onto a single chart.
It automatically identifies and draws significant horizontal support and resistance zones from five different time horizons, ranging from the 15-minute chart up to the daily view.
This functionality allows traders to see where major market players are likely to react without the need to constantly flip through various windows.
These zones often represent high-probability turning points or breakout levels.
Because the indicator updates in real-time, it ensures that traders are always aware of the nearest structural barriers.
Free Download
Key Features
- The indicator simultaneously displays levels from five distinct timeframes on your current chart.
- Default settings include 1-day, 4-hour, 1-hour, 30-minute, and 15-minute intervals.
- Fully customizable inputs allow users to select their preferred timeframes and look-back periods.
- Individual color settings for each level help distinguish between short-term and long-term significance.
Indicator Chart
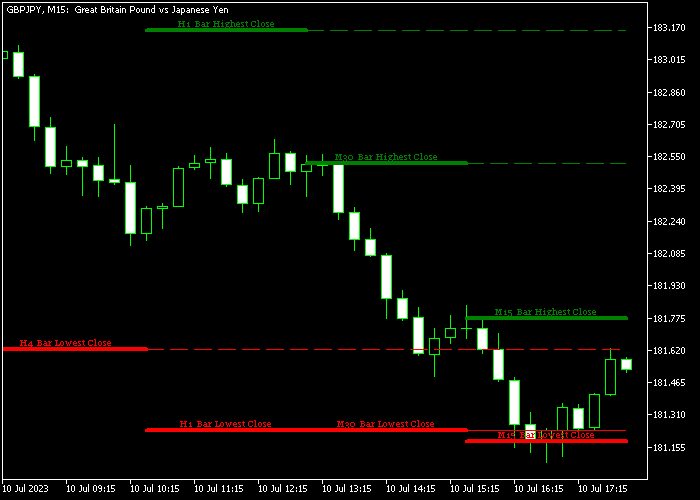
The chart shows the MTF Support & Resistance indicator active on the GBPJPY pair.
You can see multiple horizontal lines representing different timeframe levels, creating a clear corridor for price movement.
The intersection of these lines indicates strong psychological areas where the market is likely to experience significant volatility.
Guide to Trade with MTF Support & Resistance Indicator
Buy Rules
- A buying opportunity is identified when the price successfully breaks above a major resistance level.
- Ensure the breakout candle closes firmly above the line to avoid potential false signals.
- Look for a retest of the broken resistance level as a high-probability entry point for a long position.
- Confirm that higher timeframe levels are not immediately above your entry to allow for room to move.
Sell Rules
- A selling opportunity occurs when the price breaks and closes below a significant support level.
- Wait for the bearish momentum to be confirmed by a candle close on the lower side of the zone.
- Execute a sell market order when the price fails to move back above the recently broken support.
- Prioritize signals where multiple timeframe support lines have been breached simultaneously.
Stop Loss
- Place a protective stop loss slightly above the broken resistance level for buy trades.
- For sell positions, set your stop loss just above the broken support level to manage risk.
- Using the nearest lower timeframe level can also serve as a logical point for stop placement.
- Always adjust your stop to break-even once the price moves away from the entry zone in your favor.
Take Profit
- Target the next available resistance level on the chart as your primary profit objective for buys.
- For sell trades, aim for the next significant support level identified by the indicator.
- Traders can also utilize a standard reward-to-risk ratio of 2.0 for consistent account growth.
- Consider closing a portion of the trade when the price reaches a higher timeframe barrier.
Multi Time Frames Support Resistance Indicator Breakout Strategy for MT5
This breakout strategy combines the Multi Time Frames Support Resistance Indicator and the Super Arrow Buy Sell Indicator to capture strong price movements when key levels are broken.
The Multi Time Frames Support Resistance Indicator highlights major levels from higher timeframes, making it easier to spot important breakout zones.
When price breaks above resistance or below support, it often leads to strong momentum moves.
The Super Arrow Buy Sell Indicator helps confirm entries with clear blue and red arrows.
This strategy focuses on trading breakouts with confirmation to avoid false moves.
It works best on M5 and M15 charts and performs strongly on major currency pairs during active sessions when volatility increases.
Buy Entry Rules
- Wait for price to break above a major resistance level identified by the Multi Time Frames Support Resistance Indicator.
- Confirm the breakout with a blue arrow from the Super Arrow Buy Sell Indicator.
- Enter a buy trade at the opening of the next candle after confirmation.
- Place a stop loss below the broken resistance level.
- Take profit when a red arrow appears or when price shows rejection at the next resistance level.
Sell Entry Rules
- Wait for price to break below a major support level identified by the MTF Support Resistance Indicator.
- Confirm the breakout with a red arrow from the Super Arrow Buy Sell Indicator.
- Enter a sell trade at the opening of the next candle after confirmation.
- Place a stop loss above the broken support level.
- Take profit when a blue arrow appears or when price reacts at the next support level.
Case Study 1
On EURUSD M15, price approached a strong resistance level identified by the MTF Support Resistance Indicator.
After a period of consolidation, price broke above the level, signaling a breakout.
The Super Arrow Buy Sell Indicator printed a blue arrow, confirming the buy setup.
A buy trade was entered at the next candle open with stop loss placed below the broken resistance.
Price moved higher with strong momentum following the breakout.
The trade was closed for 35 pips when a red arrow appeared, indicating a potential slowdown in momentum.
Case Study 2
On GBPJPY M5, price tested a key support level highlighted by the Multi Time Frames Support Resistance Indicator.
Price broke below the level with strong bearish pressure.
The Super Arrow Buy Sell Indicator showed a red arrow, confirming the sell opportunity.
A sell trade was opened at the next candle with stop loss placed above the broken support.
Price dropped quickly as selling pressure increased.
The short position was closed when a blue arrow appeared, signaling a possible reversal.
Download Now
FAQ
Can I change the default timeframes used by the indicator?
Yes, you can modify all five timeframe inputs in the indicator settings.
Why are some support and resistance lines thicker than others?
While the indicator draws levels, the significance of a level is often determined by the timeframe it originates from.
Many traders choose to color-code or manually recognize that daily levels carry more weight than 15-minute levels during their analysis.
How do I handle a situation where levels from different timeframes are very close?
When levels from multiple timeframes cluster together, they create a “zone of confluence.”
These areas are considered much stronger than isolated levels and often lead to significant price reactions when reached.
Summary
The MTF Support & Resistance indicator is a popular trend analysis tool offering reliable signals for buying and selling pairs in the Forex market.
Whether used as a standalone strategy or as a filter for other indicators, it excels at identifying the key battlegrounds between buyers and sellers.
Overall, it is an indispensable tool for anyone looking to trade with the flow of institutional levels.


