
About the LSMA Indicator
The LSMA indicator for MT5 is a technical tool that utilizes least squares regression to calculate the most likely path of price action.
Unlike traditional moving averages that often suffer from significant lag, this indicator focuses on minimizing the distance between the data points and the average line.
The primary advantage of using this indicator is its ability to stay closer to the actual price candles.
It functions as a dynamic support and resistance level that adjusts in real-time to market volatility.
Because it is designed to be highly responsive, it is particularly effective in fast-moving markets where timing is important.
Traders can use it to maintain a clear perspective on the dominant market direction while avoiding the noise that often leads to false signals in choppy environments.
Free Download
Key Features
- The indicator provides a specialized calculation that significantly reduces lag compared to standard averages.
- The line reacts instantly to price shifts, allowing for faster trend identification and execution.
- Customizable smoothing depth settings enable traders to balance sensitivity with signal reliability.
- Adjustable horizontal and vertical shifts allow for better alignment with specific trading styles.
Indicator Chart
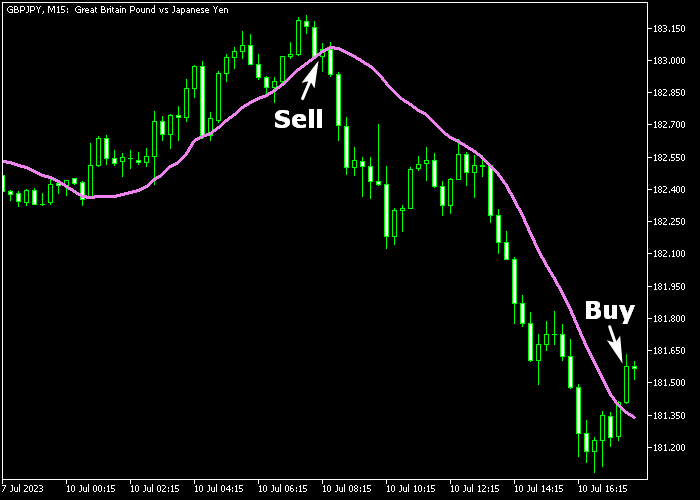
The chart displays the LSMA indicator as a purple line following the price action closely.
You can see how the trend is defined by the position of the candles relative to the line.
When price crosses the indicator, it marks a shift in momentum that traders can use for trade entries.
Guide to Trade with the LSMA Indicator
Buy Rules
- A buy trend occurs when the candle closes above the purple colored LSMA line from below.
- Execute a buy market order immediately following the confirmed bullish candle close.
- Verify that the slope of the line is starting to point upward to support the long bias.
- Maintain the buy position as long as the price stays above the indicator line.
Sell Rules
- A sell trend occurs when the candle closes below the purple colored LSMA line from above.
- Execute a sell market order as soon as the bearish crossover is established.
- Ensure the price remains under the purple line to validate the ongoing downward momentum.
- Keep the short trade active until the price action shows signs of a bullish reversal.
Stop Loss
- Set a protective stop loss below the previous swing low level for all buy orders.
- For sell trades, place your stop loss above the previous swing high level to protect capital.
- The LSMA line can be used to trail the stop loss as the trend progresses in your favor.
- Always adjust the stop to break-even once the trade reaches a significant profit milestone.
Take Profit
- Close the position and reverse the trade when a candle closes on the opposite side.
- Targeting known structural levels like previous peaks or valleys is a sound exit strategy.
- Manual exits are recommended if the line begins to flatten, indicating a loss of momentum.
LSMA Forex Scalping Strategy for MT5
This scalping strategy combines the LSMA Indicator and the Clever Forex Scalper Indicator to capture quick trend‑aligned moves.
The LSMA Indicator tells whether price is above or below the purple line, giving a clear bias for bullish or bearish conditions.
The Clever Forex Scalper Indicator provides clean entry signals with blue and red arrows that match intraday momentum.
This strategy aims to trade in the direction of the prevailing trend while using precise scalper signals to enter high‑probability setups.
It works best on M1 and M5 timeframes, especially on liquid currency pairs and Gold where price moves quickly and consistently during active market hours.
Buy Entry Rules
- Wait for price to be above the purple LSMA line, indicating a bullish condition.
- Confirm the entry with a blue arrow from the Clever Forex Scalper Indicator.
- Enter a buy trade at the opening of the next candle after the arrow appears.
- Place the stop loss below the most recent swing low or just under the LSMA line for tight risk control.
- Take profit when a red arrow appears or when price shows clear rejection near a recent high.
Sell Entry Rules
- Wait for price to be below the purple LSMA line, indicating a bearish condition.
- Confirm the entry with a red arrow from the Clever Forex Scalper Indicator.
- Enter a sell trade at the opening of the next candle after the arrow appears.
- Set the stop loss above the most recent swing high or just above the LSMA line to limit risk.
- Take profit when a blue arrow appears or when price shows rejection near a recent low.
Case Study 1
On NZDUSD M1 during peak London hours, price was trading above the purple LSMA line, signaling bullish conditions after a breakout of a short consolidation.
The Clever Forex Scalper Indicator printed a blue arrow during a minor pullback, giving a suitable entry opportunity.
A buy order was placed at the next candle open with stop loss set just below the recent swing low.
Price continued upward with strong intraday momentum as buyers dominated the session.
The trade was exited for +11 pips when a red arrow appeared, suggesting weakening momentum and a possible reversal.
Case Study 2
On USDCHF M5 during the New York session, price was consistently below the purple LSMA line, confirming a bearish drift following a failed rally.
The Clever Forex Scalper Indicator printed a red arrow, validating the sell setup.
A sell trade was initiated at the next candle with a protective stop loss placed above the recent swing high.
Price moved lower with steady downward pressure as the session progressed.
The position was closed for +23 pips when a blue arrow appeared, indicating a shift in short‑term momentum and signaling an exit.
Download Now
FAQ
How does the LSMA indicator differ from a Simple Moving Average?
The LSMA indicator uses linear regression to plot a line that best fits the price data.
This makes it far more responsive to recent price changes than a Simple Moving Average.
What is the best timeframe for using the LSMA indicator?
Day traders often prefer the 15-minute and 1-hour charts for quick moves, while swing traders use the 4-hour or daily charts to capture larger trend extensions without the distraction of minor price fluctuations.
Can the LSMA indicator be used to identify ranging markets?
When the price starts weaving frequently across the purple line and the line itself becomes horizontal, the market is likely in a range.
Is the LSMA indicator suitable for scalping Forex pairs?
Yes, because of its low-lag nature, it is an excellent tool for scalpers.
By adjusting the smoothing depth, you can capture short-term price bursts that traditional indicators might miss until the move is nearly over.
Summary
The LSMA indicator is a popular trend analysis tool offering reliable signals for buying and selling pairs in the Forex market.
The ability to customize shifts and smoothing makes it adaptable to various market conditions and assets.
By focusing on minimizing lag, it ensures that your technical analysis stays aligned with current price action.
Overall, it is an essential tool for those seeking a modern and mathematically sound trend-following system.


