
About the Murreys Math Oscillator Indicator
The Murreys Math Oscillator Indicator for MT5 is a momentum-based tool that helps traders identify the prevailing market direction and possible trading opportunities.
It converts Murrey Math calculations into a histogram format that highlights whether bullish or bearish pressure is dominant.
The indicator appears in a separate window below the price chart and displays colored histogram bars that move above and below the zero level.
These bars reflect the current trend strength and momentum conditions in the market.
When the histogram remains above zero, the indicator suggests that buyers are in control and the market may continue higher.
When the histogram drops below zero, it indicates increasing selling pressure.
The indicator does not repaint its signals, which allows traders to analyze signals with confidence.
Free Download
Murreys_Math_Oscillator.mq5 Indicator (MT5)
Key Features
- Momentum oscillator based on Murrey Math calculations.
- Colored histogram bars display bullish and bearish conditions.
- Signals do not repaint once they appear.
- Can be used as a standalone trend confirmation tool.
- Adjustable period and multiplier parameters.
- Optional level display for additional analysis.
Indicator Chart
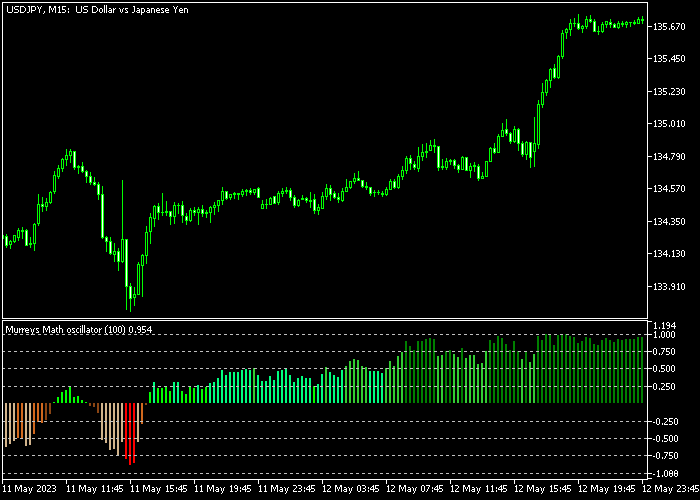
The Murreys Math Oscillator appears in a separate window under the price chart as a colored histogram.
In the example, green bars develop above the zero level during bullish momentum, while brown bars appear below the midpoint when bearish conditions strengthen.
Guide to Trade with Murreys Math Oscillator
Buy Rules
- Watch the oscillator histogram for bars moving above the zero level.
- Wait for green bars to begin forming in the indicator window.
- This indicates that bullish momentum may be developing.
- Open a buy trade once the positive histogram bars appear.
Sell Rules
- Monitor the oscillator for bars dropping below the zero level.
- Wait for brown bars to appear in the histogram.
- This condition suggests that selling pressure is increasing.
- Open a sell trade when the first bearish histogram bars form.
Stop Loss
- Place the stop loss slightly below a recent support zone for buy trades.
- Place the stop loss slightly above a nearby resistance zone for sell trades.
- Some traders add a small buffer of a few pips beyond the level.
Take Profit
- Close the buy position if the histogram falls back below the zero level.
- Close the sell position if the histogram moves back above zero.
- Traders may also trail profits as long as the histogram remains in the same direction.
MT5 Murrey’s Math Oscillator Scalping Strategy
This scalping strategy combines the Murrey’s Math Oscillator Indicator with the EMA Trend Catcher Indicator to create a fast and clear momentum-based trading system.
The Murrey’s Math Oscillator measures market momentum around the zero level.
When the histogram crosses back above zero and turns green, it signals growing bullish pressure.
When the histogram stays below zero and shows brown bars, it confirms bearish momentum.
This helps traders quickly identify short-term directional shifts.
The EMA Trend Catcher indicator provides precise entry confirmation through arrows.
A blue arrow appears when a bullish crossover happens, while a red arrow signals a bearish crossover.
This combination works well for scalping on M1 and M5 timeframes.
Buy Entry Rules
- Wait for the Murrey’s Math Oscillator histogram to cross above the zero level and turn green.
- Confirm that a blue arrow appears from the EMA Trend Catcher indicator.
- Enter a buy trade at the close of the signal candle.
- Place stop loss below the most recent swing low.
- Close the trade when the histogram turns brown and moves below zero or when a red arrow appears.
Sell Entry Rules
- Wait for the Murrey’s Math Oscillator histogram to stay below the zero level with brown bars.
- Confirm that a red arrow appears from the EMA Trend Catcher indicator.
- Enter a sell trade at the close of the signal candle.
- Place stop loss above the most recent swing high.
- Close the trade when the histogram turns green and crosses above zero or when a blue arrow appears.
Case Study 1: USDCHF M1 Bullish Scalping Setup
On USDCHF M1, the Murrey’s Math Oscillator crossed above the zero level and printed green bars, showing a shift into bullish momentum.
Shortly after, a blue arrow appeared from the EMA Trend Catcher indicator.
A buy trade was opened at the close of the signal candle.
The stop loss was placed below the most recent swing low to protect against quick reversals.
Price moved upward for several candles before slowing down.
The long trade was closed when the histogram turned brown and dropped below zero, indicating that bullish momentum had ended and a reversal phase was starting.
Case Study 2: AUDJPY M5 Bearish Scalping Setup
On AUDJPY M5, the Murrey’s Math Oscillator remained below zero with strong brown bars, confirming bearish pressure.
A red arrow appeared from the EMA Trend Catcher indicator, aligning with the downward movement.
A sell trade was entered at the close of the signal candle.
The stop loss was placed above the recent swing high to allow room for minor pullbacks.
After entry, price continued downward but began to lose strength.
The short trade was closed when a green histogram bar appeared and crossed above zero, showing that sellers were losing control and a potential upward correction was beginning.
Download Now
Murreys_Math_Oscillator.mq5 Indicator (MT5)
FAQ
What does the zero level represent in the Murrey’s Math Oscillator?
The zero level separates bullish and bearish momentum. When histogram bars stay above this level, buying pressure is stronger.
When bars remain below it, the market tends to favor sellers.
When is the best time to use this indicator?
Many traders prefer using it during the London and New York trading sessions when market liquidity and volatility are higher.
These sessions often produce stronger momentum signals.
Can the indicator be combined with other tools?
Yes. Traders often combine it with support and resistance levels, moving averages, or price action analysis to strengthen trade confirmation.
Summary
The Murreys Math Oscillator offers a straightforward way to monitor market momentum using histogram bars.
The movement above and below the zero level makes it easy to determine whether bullish or bearish pressure is dominant.
Because the signals do not repaint, traders can evaluate setups with greater confidence.
The indicator can be used on its own or as part of a broader technical trading strategy.
With adjustable parameters and simple interpretation, the Murrey Math Oscillator can support traders looking to follow market momentum and identify potential trading opportunities.





