About the Money Meter Indicator
The Money Meter Indicator for MT5 is a trade management tool designed to help traders monitor and organize their trading positions directly from the price chart.
Instead of analyzing entry signals, this indicator focuses on position sizing, grid levels, and overall trade management.
This allows traders to quickly evaluate their trade exposure and plan position scaling without switching between multiple tools or calculations.
Money Meter is commonly used by traders who manage multiple orders or apply grid-based trading approaches.
It helps visualize price levels, lot progression, and position spacing so traders can better understand how their positions are distributed across the market.
This tool is highly customizable and allows users to adjust several parameters including grid step values, lot sizes, progression logic, and visual appearance.
Free Download
Money-Meter.mq5 Indicator (MT5)
Key Features
- Displays trade management levels directly on the price chart.
- Helps traders organize grid or multi-order strategies.
- Shows price levels and position spacing for better planning.
- Supports customizable lot size progression.
- Adjustable grid step value for order placement.
- Visual lines highlight potential order levels.
- Customizable colors, line style, and width.
- Information panel can be placed in different chart corners.
Indicator Chart
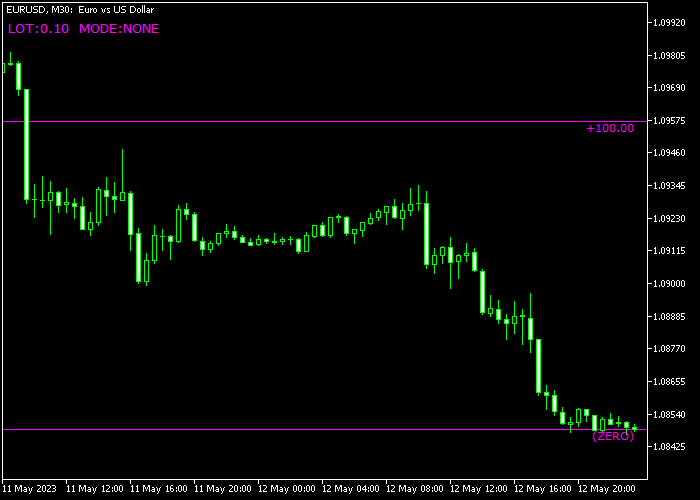
The Money Meter Indicator appears directly on the price chart by drawing horizontal levels and displaying trading information in a small panel.
The example shows how grid levels are spaced across the chart while the information panel provides details about lot size progression and level spacing used for trade management.

Guide to Trade with Money Meter Indicator
Buy Rules
- Use the grid levels to plan potential buy entry zones.
- Wait for price to approach one of the predefined lower levels.
- Confirm market conditions with your preferred trading method.
- Open a buy position near the selected level.
Sell Rules
- Use the upper grid levels to identify possible sell areas.
- Wait for price to reach one of the higher levels displayed.
- Confirm the setup using additional market analysis.
- Open a sell position near the chosen grid level.
Stop Loss
- Place the stop loss slightly beyond the next grid level.
- Another approach is positioning the stop beyond a nearby support or resistance area.
- Ensure the stop placement aligns with your overall risk management plan.
Take Profit
- Close the trade near the next grid level displayed on the chart.
- Traders may also close partial positions at multiple levels.
- Manage profits based on the planned grid progression strategy.
Download Now
Money-Meter.mq5 Indicator (MT5)
FAQ
What is the main purpose of the Money Meter indicator?
The indicator is designed to assist with trade management rather than signal generation.
It helps traders visualize grid levels, position spacing, and lot size progression directly on the chart.
Can the Money Meter indicator be used with any strategy?
Yes. Since it focuses on trade management, it can be combined with almost any trading strategy, including price action, trend trading, or grid systems.
What does the grid step value control?
The grid step value determines the distance between each level drawn on the chart.
Adjusting this setting changes how far apart potential order levels are positioned.
Summary
The Money Meter Indicator provides traders with a structured way to manage positions directly on the price chart.
By displaying grid levels and lot progression information, it helps traders plan and monitor their trade exposure more effectively.
Unlike traditional indicators that focus on signals, this tool focuses on organization and risk management.
It allows traders to visualize their strategy and maintain consistency in position sizing.


