
About the Pivot Oscillator Indicator
The Pivot Oscillator Indicator for MT5 is a momentum based trading tool designed to highlight potential buy and sell opportunities using a combination of three moving averages.
By analyzing the relationship between fast, medium, and slow averages, the indicator converts price movement into a simple oscillator that helps traders identify trend direction.
The oscillator appears beneath the main price area as a colored histogram.
When the histogram remains above the zero line, the market is considered to be in a bullish phase.
When the bars move below zero, bearish momentum is taking control.
This makes the indicator useful for both trend confirmation and entry timing.
Short term traders often find it most responsive during high volatility periods such as the London and New York trading sessions.
Free Download
Pivot_Oscillator.mq5 Indicator (MT5)
Key Features
- Momentum oscillator built from three moving averages.
- Displays colored histogram bars to represent trend direction.
- Zero level separates bullish and bearish momentum.
- Helps traders identify trend continuation and reversals.
- Customizable MA periods and calculation method.
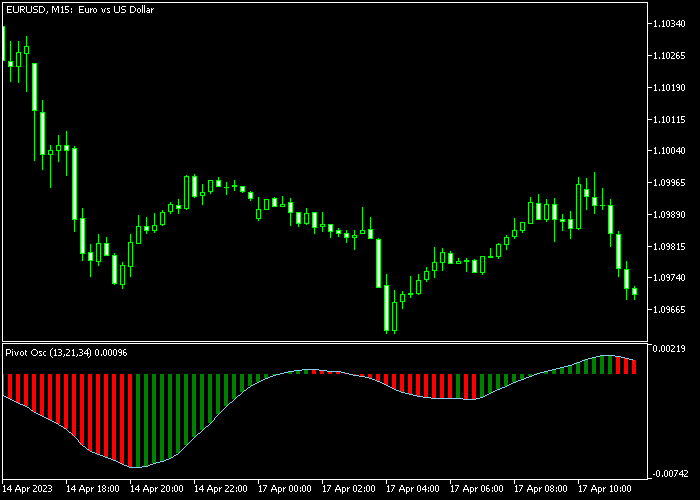
Indicator Chart
The Pivot Oscillator Indicator appears beneath the main price area as a histogram that fluctuates above and below the zero level.
Bars above zero reflect bullish momentum while bars below zero indicate bearish market pressure.
Guide to Trade with Pivot Oscillator Indicator
Buy Rules
- Wait for the first Pivot oscillator bar to cross above the zero level.
- Confirm that bullish momentum continues building after the crossover.
- Open a buy trade once the histogram remains above zero.
- Avoid entering if price is approaching a strong resistance level.
Sell Rules
- Wait for the first Pivot oscillator bar to cross below the zero level.
- Confirm that bearish momentum is strengthening.
- Open a sell trade once the histogram remains below zero.
- Avoid entering trades if the market is near strong support.
Stop Loss
- Place the stop loss slightly below the most recent price swing for buy trades.
- Place the stop loss slightly above the recent price swing for sell trades.
- Keep risk controlled by maintaining consistent position sizing.
Take Profit
- Exit the buy position if the oscillator crosses back below zero.
- Exit the sell position if the oscillator crosses back above zero.
- Secure profits early if price approaches strong support or resistance.
Pivot Oscillator Day Trading Strategy for MT5
This day trading strategy combines the Pivot Oscillator Indicator with the Trend Rider Indicator to build a system that follows momentum shifts while staying aligned with clear price direction.
The Pivot Oscillator measures short-term market pressure around pivot dynamics.
When the first oscillator bar moves above the zero level, it signals a potential buy entry. When the first bar moves below zero, it signals a potential sell entry.
The Trend Rider Indicator confirms trend direction through candlestick color sequences.
Consecutive green candles indicate a bullish trend where buyers are in control. Consecutive red candles indicate a bearish trend where sellers dominate.
This helps filter trades and avoid weak or inconsistent market phases.
This approach is most effective during active trading hours when liquidity increases and price movements become more directional, especially in the London and New York sessions where intraday setups form more frequently.
Buy Entry Rules
- Wait for consecutive green candles on the Trend Rider Indicator, confirming bullish trend direction.
- Wait for the first Pivot Oscillator bar to close above the zero level.
- Enter a buy trade at the close of the confirmation candle.
- Place a stop loss below the most recent swing low or below a recent support structure.
- Take profit when a red Pivot Oscillator bar appears or when red Trend Rider candles begin forming.
Sell Entry Rules
- Wait for consecutive red candles on the Trend Rider Indicator, confirming bearish trend direction.
- Wait for the first Pivot Oscillator bar to close below the zero level.
- Enter a sell trade at the close of the confirmation candle.
- Set the stop loss above the most recent swing high or above a recent resistance structure.
- Take profit when a green Pivot Oscillator bar appears or when green Trend Rider candles begin forming.
Case Study 1: AUDUSD M15 Buy Setup
On AUDUSD M15, price moved out of a consolidation phase and began printing consecutive green candles on the Trend Rider Indicator, confirming bullish control in the market.
Shortly after, the Pivot Oscillator printed its first bar above the zero level, confirming upward momentum alignment.
A buy trade was entered at the close of that candle.
The stop loss was placed below the most recent swing low and slightly under the consolidation zone to protect against short-term retracements.
The long trade was closed when the Pivot Oscillator printed a red bar below zero, signaling weakening bullish momentum.
Case Study 2: GBPJPY H1 Sell Setup
On GBPJPY H1, price rejected a resistance zone and started forming consecutive red candles on the Trend Rider Indicator, confirming bearish trend conditions.
The Pivot Oscillator then printed its first bar below the zero level, confirming downward momentum.
A sell trade was entered at the close of the signal candle.
The stop loss was placed above the most recent swing high and slightly above the resistance area to allow for normal volatility.
Price moved downward in a steady trend with small corrections but remained aligned with bearish candle structure.
The short trade was closed when green candles began forming on the Trend Rider Indicator, signaling a possible shift in direction.
Download Now
Pivot_Oscillator.mq5 Indicator (MT5)
FAQ
Why does the indicator use three moving averages?
The fast, medium, and slow moving averages work together to capture both short term and longer term momentum shifts in the market.
Is the Pivot Oscillator suitable for scalping?
Yes. Many traders use it for short term strategies because the oscillator reacts quickly to changes in price momentum.
Can I modify the oscillator settings?
Yes. Traders can adjust the fast, medium, and slow moving average periods as well as the moving average method used for the calculation.
Summary
The Pivot Oscillator offers a straightforward way to monitor market momentum using a zero line histogram system.
By combining three moving averages, it translates price movement into an oscillator that highlights bullish and bearish phases.
This makes it easier for traders to spot potential entry points when momentum shifts in the market.
The signals can also help confirm broader trend direction when used together with price action or support and resistance analysis.
With flexible moving average settings and a clear visual display, this tool can be applied to many different trading styles and timeframes.


