About the QQE of RSI Indicator
The QQE of RSI Indicator for MT5 combines two popular momentum tools into a single trading indicator.
It merges the Relative Strength Index with the Quantitative Qualitative Estimation technique to produce smoother and more responsive trading signals.
This combination helps traders identify potential trend changes and momentum shifts with greater accuracy.
It displays a signal line that changes color depending on the current market direction.
A blue signal line represents bullish market momentum and suggests that buyers are gaining control.
A brown signal line represents bearish momentum and indicates increasing selling pressure.
The indicator includes several adjustable parameters such as the RSI period, average period, fast and slow periods, calculation method, and applied price.
Free Download
QQE of rsi(oma).mq5 Indicator (MT5)
Key Features
- Combines RSI momentum analysis with the QQE smoothing technique.
- The blue signal line represents bullish market momentum.
- The brown signal line represents bearish market momentum.
- Helps traders detect potential trend changes and momentum shifts.
- Includes adjustable settings such as RSI period and averaging method.
- Provides fast and slow period inputs for signal tuning.
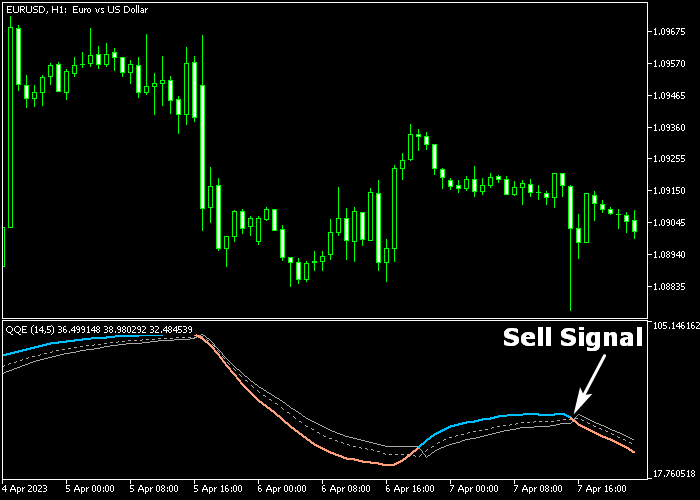
Indicator Chart
The QQE of RSI Indicator highlights momentum shifts using a color-changing signal line in the indicator window below the price area.
When the line turns blue it reflects bullish pressure, while a brown line signals bearish momentum.
Traders monitor these transitions to identify potential entry opportunities as the market direction changes.

Guide to Trade with QQE of RSI Indicator
Buy Rules
- Wait for the signal line to turn blue in the indicator window.
- This color change indicates the start of bullish momentum.
- Open a buy trade once the blue signal line appears.
- Confirm the trade with price movement that supports an upward trend.
Sell Rules
- Wait for the signal line to turn brown in the indicator window.
- This color change signals the start of bearish momentum.
- Open a sell trade when the brown signal line appears.
- Monitor the position while downward momentum develops.
Stop Loss
- Place the stop loss around 3 pips below short-term support for buy trades.
- For sell trades, position the stop loss about 3 pips above short-term resistance.
- Consider moving the stop loss to break-even once the trade gains momentum.
Take Profit
- Target a profit range between 10 and 35 pips, depending on market conditions and chosen timeframe.
- Close buy trades if the signal line changes from blue to brown.
- Close sell trades if the signal line switches from brown to blue.
- Traders may also partially close positions as the price approaches nearby resistance or support levels.
QQE of RSI Forex Scalping Strategy for MT5
This scalping strategy combines the QQE of RSI Forex Indicator with the Simple Scalp MTF Indicator to create a fast and responsive trading system.
In this setup, the QQE signal line turning blue reflects bullish momentum, while a brown signal line indicates bearish pressure.
This allows traders to quickly align with the dominant direction of the market.
The Simple Scalp MTF indicator adds precise timing with arrow signals.
A green arrow marks a buy entry, while a brown arrow signals a sell entry.
This strategy is most effective on M1 and M5 charts during London and US sessions when volatility is higher and price moves with clearer trend direction.
Buy Entry Rules
- Confirm that the QQE of RSI signal line is blue, indicating bullish momentum.
- Wait for a green arrow from the Simple Scalp MTF indicator.
- Enter a buy trade at the close of the signal candle.
- Place a stop loss below the recent swing low or just below a short-term support level.
- Close the trade when the QQE line turns brown or when a brown arrow appears.
Sell Entry Rules
- Confirm that the QQE of RSI signal line is brown, indicating bearish momentum.
- Wait for a brown arrow from the Simple Scalp MTF indicator.
- Enter a sell trade at the close of the signal candle.
- Set the stop loss above the recent swing high or just above a short-term resistance level.
- Close the trade when the QQE line turns blue or when a green arrow appears.
Case Study 1: EURGBP M5 London Session Buy Trade
On EURGBP M5 during the London session, the QQE signal line turned blue and stayed stable, confirming bullish momentum.
A green arrow appeared after a short pullback, signaling a continuation entry. A buy trade was opened at the close of the signal candle.
The stop loss was placed below a recent support level formed during the retracement.
The long trade was closed when the QQE line turned brown, showing that bullish momentum had faded and the upward move was ending.
Case Study 2: USDJPY M1 US Session Sell Trade
On USDJPY M1 during the US session, the QQE signal line turned brown, confirming bearish pressure in the market.
A brown arrow appeared during a small upward retracement, providing a sell entry. A sell trade was opened at the close of the signal candle.
The stop loss was placed above the recent swing high to allow normal price fluctuation.
The short trade was closed when a green arrow appeared and the QQE line shifted to blue, indicating that selling pressure had weakened and a reversal was starting.
Download Now
QQE of rsi(oma).mq5 Indicator (MT5)
FAQ
What is the purpose of the QQE of RSI indicator?
The indicator combines RSI momentum with the QQE smoothing technique to generate clearer trading signals.
This helps reduce noise and highlights potential changes in market direction.
Is the indicator suitable for all timeframes?
Yes, the indicator can be used on different timeframes.
Many traders prefer using it on lower to medium timeframes where momentum shifts occur more frequently.
Summary
The QQE of RSI Indicator provides traders with a momentum-based method for identifying market direction.
By combining RSI calculations with the QQE smoothing technique, the indicator produces signals that highlight potential trend changes.
The color-based signal line allows traders to quickly recognize bullish and bearish conditions.
With adjustable parameters and simple visual signals, the indicator offers a practical approach for monitoring momentum and identifying possible trading opportunities in the forex market.


