
About the Rahul Mohindar Oscillator Indicator
The Rahul Mohindar Oscillator Indicator for MT5 is a trend-following momentum tool designed to track the dominant direction of the market.
It calculates signals using three exponential moving averages and converts the result into a colored histogram that reflects bullish or bearish momentum.
Instead of displaying a traditional line, it plots histogram bars that change color depending on the current market direction.
Green histogram bars represent bullish momentum and suggest that the market may be entering or continuing an upward move.
Red histogram bars represent bearish momentum and indicate that sellers may be dominating the market.
Traders can also modify several parameters such as the three EMA periods and the applied price to adjust the indicator’s sensitivity.
Free Download
Rahul_Mohindar_Osc.mq5 Indicator (MT5)
Key Features
- Trend oscillator based on three exponential moving averages.
- Displays colored histogram bars to show market momentum.
- Histogram moves above and below the zero level.
- Does not repaint previous signals.
- Customizable EMA period inputs.
- Works on any timeframe and currency pair.
Indicator Chart
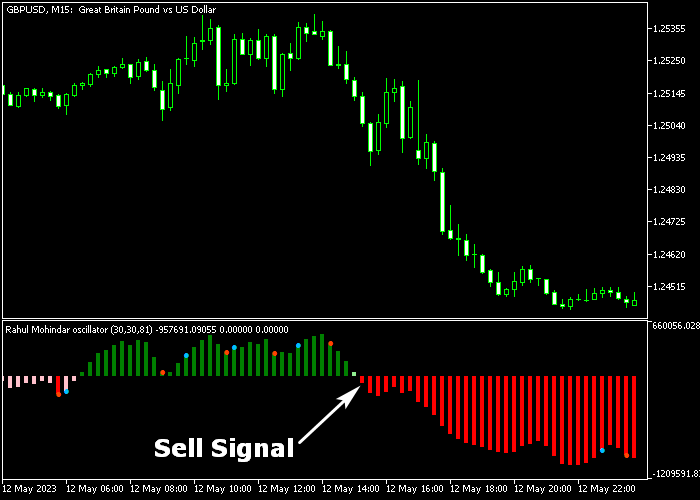
The Rahul Mohindar Oscillator Indicator appears in a separate window below the price chart as a colored histogram.
The example shows how green bars form above the zero level during bullish momentum, while red bars develop below the midpoint when bearish pressure increases.
Guide to Trade with Rahul Mohindar Oscillator Indicator
Buy Rules
- Watch the oscillator histogram approaching the zero level from below.
- Wait for the bars to cross above the midpoint and turn green.
- This movement signals that bullish momentum may be increasing.
- Open a buy trade once the first green bar forms above zero.
Sell Rules
- Observe the histogram moving toward the zero level from above.
- Wait for the bars to cross below the midpoint and turn red.
- This shift suggests that bearish momentum may be strengthening.
- Open a sell trade when the first red bar appears below zero.
Stop Loss
- Set the stop loss slightly below a nearby support zone for buy trades.
- Place the stop loss slightly above a nearby resistance zone for sell trades.
- Adjust the stop distance depending on the volatility of the trading pair.
Take Profit
- Close the buy trade if the histogram returns below the zero level.
- Close the sell trade if the histogram moves back above the midpoint.
- Some traders scale out positions as the histogram momentum begins to weaken.
MT5 Rahul Mohindar Forex Oscillator Day Trading Strategy
This strategy combines the Rahul Mohindar Forex Oscillator with the Jurik Moving Average Indicator to create a clear momentum and trend-based trading system.
The Rahul Mohindar Oscillator is used to measure momentum and identify trend strength.
When the histogram crosses above the zero level and turns green, it signals bullish momentum.
When the histogram is below zero and shows red bars, it confirms bearish pressure.
The Jurik Moving Average is used as a trend filter.
When price closes above the moving average, the market is considered bullish. When price is below it, the trend is bearish.
This indicator combination works well on M5 and M15 timeframes.
It is suitable for traders who want to follow intraday trends with clear confirmation and simple exit rules.
Buy Entry Rules
- Confirm that price is trading above the Jurik Moving Average, indicating a bullish trend.
- Wait for the Rahul Mohindar histogram to cross above the zero level and turn green.
- Enter a buy trade at the close of the signal candle.
- Place a stop loss below the Jurik Moving Average or below the most recent swing low.
- Take profit or close the trade when the histogram turns red or moves back below zero.
Sell Entry Rules
- Confirm that price is trading below the Jurik Moving Average, indicating a bearish trend.
- Wait for the Rahul Mohindar histogram to stay below zero and show red bars.
- Enter a sell trade at the close of the signal candle.
- Place the stop loss above the Jurik Moving Average or above the most recent swing high.
- Take profit or close the trade when the histogram turns green or moves back above zero.
Case Study 1: EURJPY M15 London Session Buy Trade
On EURJPY M15 during the London session, price moved above the Jurik Moving Average and held above it for several candles, confirming a bullish trend.
Shortly after, the Rahul Mohindar histogram crossed above the zero level and turned green.
A buy trade was opened at the close of the signal candle.
The stop loss was placed below the recent swing low and slightly below the moving average to protect against sudden pullbacks.
The buy trade was closed when the histogram turned red and dropped back toward the zero level.
Case Study 2: AUDUSD M5 New York Session Sell Trade
On AUDUSD M5 during the New York session, price stayed below the Jurik Moving Average, confirming bearish conditions.
The market formed lower highs and continued downward.
The Rahul Mohindar histogram remained below zero and printed red bars, confirming selling momentum.
A sell trade was entered at the close of a bearish candle.
The stop loss was placed above the most recent swing high and above the moving average to allow room for minor retracements.
The short trade was closed when the histogram turned green and crossed above zero.
This indicated that sellers had lost control and a reversal or correction was starting.
Download Now
Rahul_Mohindar_Osc.mq5 Indicator (MT5)
FAQ
What is the main purpose of the Rahul Mohindar oscillator?
The indicator is designed to identify the dominant trend direction using a combination of exponential moving averages.
Why does the indicator use three exponential moving averages?
The three EMA calculations help smooth price movement while still reacting to changes in trend momentum.
This multi-layer approach aims to provide more stable signals compared to a single moving average.
Summary
The Rahul Mohindar Oscillator Indicator provides traders with a momentum-based method for identifying market direction.
The colored histogram makes it easy to recognize when buying or selling pressure is increasing.
By combining three exponential moving averages, the indicator attempts to capture trend changes while smoothing price fluctuations.
The zero-level crossover also offers a straightforward signal for potential trade entries.
With adjustable settings and a non-repainting histogram, the Rahul Mohindar oscillator can be integrated into many trading strategies.
When used together with price action and support or resistance analysis, it can help traders follow market momentum more effectively.


