
About the RSI Bars Indicator
The RSI Bars Indicator for MT5 converts traditional RSI readings into color-coded buy and sell bars directly on your trading platform.
Traders can react instantly to overbought and oversold conditions through visual signals.
This indicator is designed for active traders targeting short intraday moves.
It performs efficiently on the 1-minute, 5-minute, and 15-minute timeframes, making it suitable for scalpers and day traders.
The goal is simple and practical: capture consistent profits in the 6 to 20 pip range per trade.
A sea-green bar signals a potential buying opportunity when the market reaches oversold territory.
A magenta bar signals a potential selling opportunity when the market reaches overbought territory.
Free Download
Key Features
- Transforms RSI data into sea-green and magenta trading bars.
- Sea-green bar signals oversold market conditions and buy setups.
- Magenta bar signals overbought market conditions and sell setups.
- Adjustable RSI period for faster or smoother signals.
- Customizable overbought and oversold levels.
- Works efficiently on M1, M5, and M15 charts.
- Designed for short-term scalping targets between 6 and 20 pips.
Indicator Chart
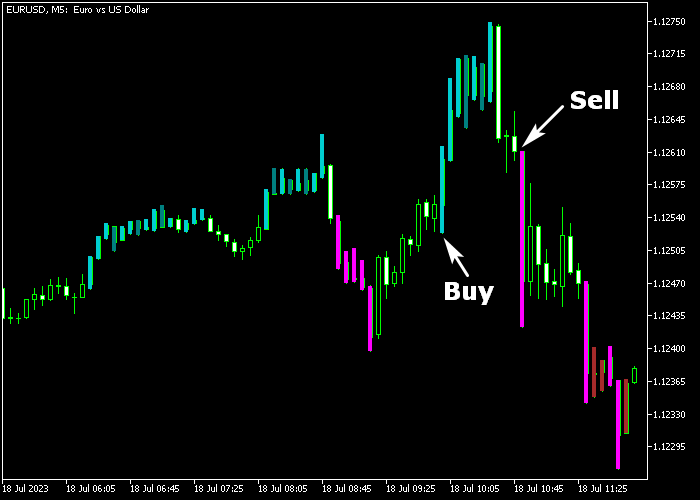
The RSI Bars Indicator displays sea-green and magenta bars directly over price, highlighting overbought and oversold reactions in real time.
On lower timeframes, clusters of sea-green bars often appear near short-term support, while magenta bars typically form near short-term resistance.
Traders use these signals to execute quick momentum trades during active sessions.

Guide to Trade with RSI Bars Indicator
Buy Rules
- A sea-green RSI bar must appear, indicating oversold market conditions.
- Ensure price reacts near short-term support or after a pullback.
- Enter a buy trade at the close of the sea-green bar.
- Focus on active trading hours such as the London or New York session.
Sell Rules
- A magenta RSI bar must appear, indicating overbought market conditions.
- Ensure price reacts near short-term resistance or after an upward spike.
- Enter a sell trade at the close of the magenta bar.
- Prioritize pairs with tight spreads for better execution.
Stop Loss
- For buy trades, place the stop slightly below short-term support.
- For sell trades, place the stop slightly above short-term resistance.
- Keep risk per trade small to suit scalping conditions.
Take Profits
- Close the buy trade within a 6 to 20 pip profit target.
- Close the sell trade within a 6 to 20 pip profit target.
- Alternatively, close the buy position when a magenta bar appears.
- Alternatively, close the sell position when a sea-green bar appears.
RSI Bars and EMA Trend Catcher MT5 Scalping Strategy
This strategy blends momentum timing with precise trend entries to create a fast and reliable scalping method.
By combining the RSI Bars Indicator MT5 with the EMA Trend Catcher Forex Indicator for MT5, traders can identify short-term opportunities with strong directional bias.
The RSI Bars indicator highlights momentum shifts using color changes.
A sea-green bar signals bullish momentum, while a magenta bar reflects bearish pressure.
The EMA Trend Catcher complements this by printing blue arrows for buy trends and red arrows for sell trends based on moving average crossovers.
This strategy works because it filters entries using both direction and timing.
The EMA Trend Catcher defines the overall move, while the RSI Bars refine the entry.
It performs strongly during the London and New York sessions where volatility provides clean and fast price movement.
The M1 and M5 timeframes are ideal for active scalpers who prefer quick trades.
Buy Entry Rules
- Wait for a blue arrow from the EMA Trend Catcher to confirm an upward trend.
- Look for a fresh sea-green RSI bar forming after the arrow appears.
- Enter a buy trade on a small pullback or at the next candle open.
- Place the stop loss below the most recent consolidation area or 5 to 8 pips below entry.
- Take profit when a magenta RSI bar appears or when a red arrow prints.
Sell Entry Rules
- Wait for a red arrow from the EMA Trend Catcher to confirm a downward trend.
- Look for a fresh magenta RSI bar forming after the arrow appears.
- Enter a sell trade on a minor retracement or at the next candle open.
- Place the stop loss above the recent price structure or 5 to 8 pips above the entry.
- Take profit when a sea-green RSI bar appears or when a blue arrow forms.
Case Study 1: USD/JPY London Session Pullback Entry
During the London session, USD/JPY showed a steady upward trend on the M1 timeframe.
A blue arrow appeared, confirming bullish direction.
Instead of entering immediately, the price made a brief pullback.
Shortly after, a sea-green RSI bar formed again, signaling renewed momentum.
A buy trade was entered at the next candle open after the pullback.
The stop loss was placed just below the consolidation zone.
Price quickly resumed upward movement as both indicators aligned again.
When the RSI Bars shifted to magenta, momentum weakened, and the position was closed at a small 5 pip loss.
Case Study 2: EUR/GBP New York Session Continuation Sell
In the New York session, EUR/GBP was already trending downward on the M5 timeframe.
A red arrow appeared, confirming bearish conditions.
Instead of entering immediately, the strategy waited for confirmation through RSI momentum.
A magenta RSI bar formed after a small upward retracement, offering a continuation entry.
A sell trade was placed at the next candle open. The stop loss was set above the recent minor high.
The price dropped steadily as selling pressure increased.
When a sea-green RSI bar appeared, the trade was exited to lock in 18 pips profit.
Download Now
FAQ
Which timeframes work best with the RSI Bars Indicator?
The indicator performs strongly on M1, M5, and M15 timeframes.
These lower intervals provide frequent signals suited for scalping and short-term day trading.
Can I modify the RSI settings?
Yes. You can adjust the RSI period, applied price, and overbought and oversold levels.
Lower periods generate more signals, while higher periods reduce signal frequency.
What is the recommended profit target?
The strategy aims for 6 to 20 pips per trade.
This range aligns with short-term market volatility during high-liquidity sessions.
Summary
The RSI Bars Indicator simplifies overbought and oversold analysis by converting RSI data into practical buy and sell bars.
It allows traders to execute quick entries without switching between multiple indicator windows.
Designed for scalpers and intraday traders, it targets controlled profits in the 6 to 20 pip range.
When combined with tight spreads, active trading sessions, and disciplined risk management, it can become a consistent short-term trading tool.





