
About the Simple Support & Resistance Breakout Indicator
The Simple Support & Resistance Breakout indicator for MT5 converts key price levels into a dynamic trend-following tool that provides timely buy and sell signals.
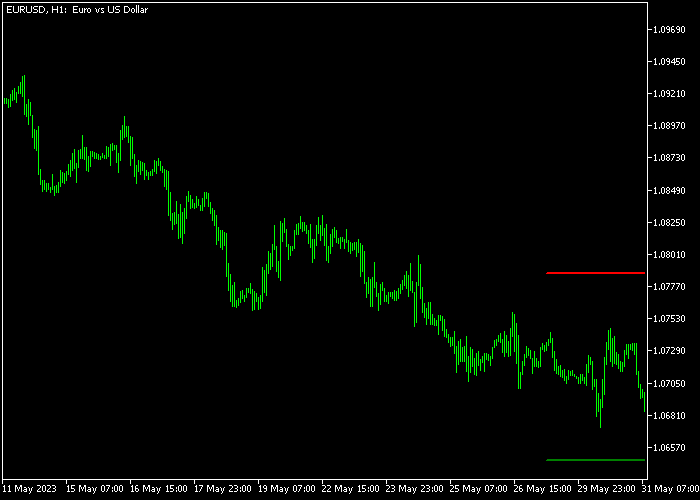
Displayed as a dual-colored line on the price chart, it shows red for resistance levels and green for support levels.
It helps traders quickly identify trend direction and potential entries during a breakout.
This technical tool is highly customizable, allowing adjustment of the period and line length.
Free Download
Simple_Support_Resistance.mq5 Indicator (MT5)
Key Features
- Automatically calculates and plots significant horizontal support and resistance levels.
- Visualizes price ceilings and floors using distinct red and green color coding.
- Identifies breakout opportunities as price closes beyond established market boundaries.
- Allows for customization of lookback periods to suit various trading styles.
Indicator Chart
The chart displays the Simple Support & Resistance Breakout indicator, highlighting significant price zones.
A green line marks the floor where buyers have previously stepped in, while a red line marks the ceiling where sellers have dominated.
Traders can watch for a decisive candle close beyond these lines to confirm a breakout and initiate a new trend-following position.
Guide to Trade with Simple Support & Resistance Breakout Indicator
Buy Rules
- The market should be in an uptrend to look for high-probability buy setups.
- Buy a candle close above the red colored resistance line to confirm the breakout.
- Ensure the breakout candle shows strong bullish momentum with a large body.
- Maintain the buy trade as long as the price stays above the new support level.
Sell Rules
- The market should be in a downtrend to prioritize short-selling opportunities.
- Sell a candle close below the green colored support line to confirm the break.
- Confirm that the bearish breakout is supported by an increase in market volume.
- Keep the sell order active until the price reaches the next major structural floor.
Stop Loss
- Open a buy trade and place your stop loss 3 pips below the previous swing support.
- Open a sell trade and place your stop loss 3 pips above the previous swing resistance.
- Use the indicator lines as a guide for placing stops just outside the breakout zone.
- Ensure the stop loss is tight enough to maintain a healthy risk-to-reward ratio.
Take Profit
- Close the buy or sell trade for a reward-to-risk ratio of at least 2.0 or a fixed target.
- Consider trailing the profit target if the breakout leads to a strong trending move.
- Liquidate the position if the price fails to hold the breakout and reverses sharply.
Simple Support Resistance Breakout MT5 Strategy with FX10 Confirmation
This breakout strategy combines the Simple Support Resistance Breakout Indicator with the FX10 Forex Signal Indicator to create a fast day trading system for M5 and M15 charts.
The focus is on clean breakouts from key price zones combined with clear signal confirmation.
The Simple Support Resistance Breakout Indicator marks key market levels directly on the chart.
A candle close above the red resistance line confirms a bullish breakout, while a candle close below the green support line confirms a bearish breakout.
The FX10 indicator is used as a confirmation tool.
A green arrow signals a buy opportunity and a magenta arrow signals a sell opportunity.
Buy Entry Rules
- Wait for a candle to close above the red resistance line from the Support Resistance Breakout Indicator.
- Confirm a green FX10 arrow appears after or at the breakout level.
- Enter a buy trade at the close of the signal candle.
- Place the stop loss below the broken resistance level or below the most recent swing low.
- Hold the trade while price stays above the broken resistance zone.
- Exit the trade when a magenta FX10 arrow appears or when price closes back below the breakout level.
Sell Entry Rules
- Wait for a candle to close below the green support line from the Support Resistance Breakout Indicator.
- Confirm a magenta FX10 arrow appears after or at the breakout level.
- Enter a sell trade at the close of the signal candle.
- Place the stop loss above the broken support level or above the most recent swing high.
- Hold the trade while price stays below the broken support zone.
- Exit the trade when a green FX10 arrow appears or when price closes back above the breakout level.
Case Study 1: Buy Trade Example (EUR/USD M15)
Price moved upward and closed above a strong red resistance line, confirming a breakout from the Support Resistance Breakout Indicator.
Shortly after the breakout, a green FX10 arrow appeared, confirming continuation momentum.
A buy trade was opened at the candle close with the stop loss placed just below the broken resistance zone.
Price continued moving higher and respected the breakout level as support.
The trade was closed when a magenta FX10 arrow appeared, signaling a potential reversal and ending the bullish phase.
Case Study 2: Sell Trade Example (GBP/JPY M5)
Price broke downward and closed below a green support line, confirming a bearish breakout.
A magenta FX10 arrow appeared soon after the breakout, confirming selling pressure.
A sell trade was opened at the candle close with the stop loss placed above the broken support zone.
Price continued lower and retested the broken level without reclaiming it.
The trade was closed when a green FX10 arrow appeared, indicating a shift in direction and completing the bearish move.
Download Now
Simple_Support_Resistance.mq5 Indicator (MT5)
FAQ
How does the period setting change the breakout levels?
The period determines the amount of historical data used to calculate support and resistance.
A smaller period identifies short-term scalping levels, while a larger period finds major structural zones.
Can this indicator be used for range trading?
Yes. While it is designed for breakouts, the red and green lines clearly show the boundaries of a range.
Traders can use them to sell at resistance and buy at support during sideways markets.
Is it better to combine this with a volume oscillator?
Combining this indicator with a volume oscillator is highly recommended.
High volume during a breakout confirms that institutional traders are participating, increasing the signal’s reliability.
Summary
The Simple Support & Resistance Breakout indicator provides a streamlined approach to technical analysis by merging trend detection with momentum filtering.
It allows traders to navigate different market conditions by visually separating bullish impulses from bearish pressure.
By focusing on price level breakouts, it helps traders enter the market exactly when momentum is at its peak.


