
About the Synthetic RSI Indicator
The Synthetic RSI Indicator for MT5 combines three Relative Strength Index indicators with three exponential moving averages to generate more reliable trend signals with fewer false alerts.
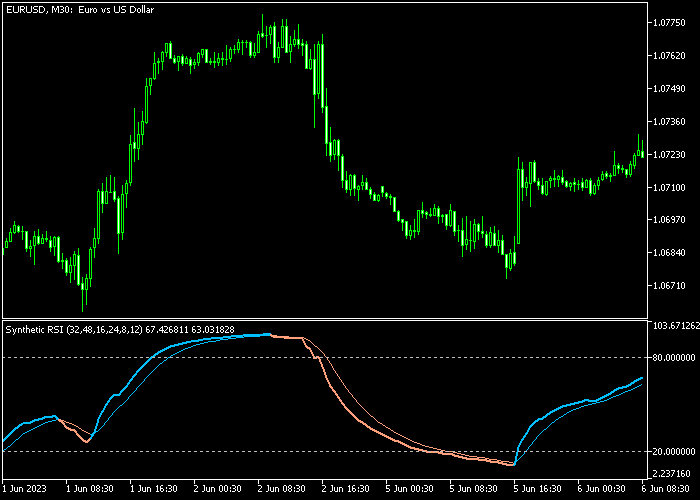
The indicator is displayed in a separate window as a blue and brown signal line that clearly shows the prevailing market direction.
A blue line signals bullish momentum, while a brown line signals bearish momentum.
Traders can customize all inputs, including EMA periods, RSI periods, applied price, and signal period, to match different trading instruments or strategies.
This tool works well as a standalone trend indicator, helping traders spot buy and sell opportunities without relying on multiple separate indicators.
It is suitable for both short-term and swing traders looking for clearer entry signals.
Free Download
Synthetic RSI.mq5 Indicator (MT5)
Key Features
- Combines three RSI indicators with three EMAs for stronger trend detection.
- Blue line signals bullish momentum; brown line signals bearish momentum.
- Non-repaint design ensures consistent signals for trade planning.
- Customizable periods for EMA and RSI, applied price, and signal period.
- Suitable for both short-term and swing trading strategies.
- Reduces false signals compared to standard RSI or EMA setups.
Indicator Chart
The Synthetic RSI Indicator displays blue and brown signal lines in a separate chart window.
Blue lines indicate bullish trends and potential buy opportunities, while brown lines indicate bearish trends and potential sell opportunities.
Traders can follow these signals to time entries and exits more effectively.
Guide to Trade with Synthetic RSI Indicator
Buy Rules
- Wait for the blue line to appear, signaling bullish momentum.
- Confirm that the price is holding above recent swing lows or support zones.
- Open a buy trade as the blue line forms for a confirmed entry.
- Optionally, check the higher timeframe trend direction for added confidence.
Sell Rules
- Wait for the brown line to appear, signaling bearish momentum.
- Confirm that the price is approaching resistance or showing signs of weakness.
- Open a sell trade as the brown line forms for confirmation.
- Optionally, check higher timeframe alignment to improve signal reliability.
Stop Loss
- For buy trades, set the stop loss below the most recent swing low price.
- For sell trades, set the stop loss above the most recent swing high price.
- Optionally, use ATR-based stops for adaptive risk management.
Take Profit
- Close buy trades when the brown line appears, or target a fixed pip gain.
- Close sell trades when the blue line appears, or target a fixed pip gain.
- Adjust take profit targets depending on market volatility and trading style.
Synthetic RSI Indicator MT5 Scalping Strategy with Keltner Channel
This scalping strategy combines the Synthetic RSI Indicator with the Keltner Channel Indicator to capture quick intraday moves with clear trend confirmation.
The Synthetic RSI uses two lines to signal direction.
The blue line gives buy signals, while the brown line gives sell signals.
The Keltner Channel provides the trend filter using its middle line.
When the middle line turns deep sky blue, the trend is bullish. When it turns pale violet red, the trend is bearish.
This method is designed for fast-paced trading on M1 and M5 timeframes.
It works well for traders who want clear signals with minimal hesitation.
Buy Entry Rules
- Wait for the Keltner Channel middle line to turn deep sky blue.
- Confirm the trend is bullish and price is holding above the middle line.
- Enter a buy trade when the Synthetic RSI blue line appears.
- Place the stop loss below the recent swing low or below the lower channel band.
- Close the trade when the Synthetic RSI line turns brown.
Sell Entry Rules
- Wait for the Keltner Channel middle line to turn pale violet red.
- Confirm the trend is bearish and price is holding below the middle line.
- Enter a sell trade when the Synthetic RSI brown line appears.
- Place the stop loss above the recent swing high or above the upper channel band.
- Close the trade when the Synthetic RSI line turns blue.
Case Study (USDCHF M5)
The Keltner Channel middle line turned deep sky blue, showing a bullish trend. Price stayed above the middle line.
The Synthetic RSI then showed a blue line. A buy trade was opened immediately after the signal. The stop loss was placed below the recent swing low.
Price moved upward within the channel while conditions remained bullish.
The trade was closed for 27 pips profit when the Synthetic RSI line turned brown.
Case Study (AUDJPY M1)
The Keltner Channel middle line turned pale violet red, confirming a bearish trend. Price stayed below the middle line.
The Synthetic RSI printed a brown line. A sell trade was opened after the signal. The stop loss was placed above the recent swing high.
Price moved downward along the channel.
The trade remained active while the conditions stayed bearish and was closed for +13 pips when the Synthetic RSI line turned blue.
Download Now
Synthetic RSI.mq5 Indicator (MT5)
FAQ
How does Synthetic RSI differ from a standard RSI?
It combines three RSI lines with three EMAs to filter out false signals and provide a smoother, more reliable trend signal.
Is this indicator suitable for both short-term and swing trades?
Yes, the Synthetic RSI can provide quick entries for scalpers and longer trend signals for swing traders, depending on the timeframe used.
Can the sensitivity of signals be adjusted?
Yes, adjusting EMA and RSI periods allows traders to fine-tune the responsiveness and number of signals according to their strategy.
Summary
The Synthetic RSI Indicator is a powerful tool that combines multiple RSI and EMA calculations to provide clear buy and sell signals.
Highlighting bullish and bearish trends with blue and brown lines helps traders make informed decisions and reduces the likelihood of false entries.
With adjustable parameters and flexible settings, this indicator can be adapted to different instruments and trading styles.
Used alongside proper stop loss and take profit management, the Synthetic RSI offers a streamlined approach to trend-based trading, making it suitable for both short-term and swing strategies.


