About the Trading the Trend Histogram Indicator
The Trading the Trend Histogram indicator for MT5 provides clear buy and sell signals using trend-following histogram bars.
It displays blue and brown bars in a separate window beneath the main chart, helping traders identify market direction at a glance.
Blue bars indicate bullish trends and potential buy opportunities, while brown bars signal bearish trends and potential sell opportunities.
The indicator never repaints, ensuring reliable signals across all timeframes supported by MT5.
Settings such as look back period, multiplier, and channel shift can be customized to match different trading strategies.
Scalpers and day traders benefit most during high-volatility sessions like London and New York.
Free Download
Trading the trend – histogram.mq5 Indicator (MT5)
Key Features
- Non-repainting histogram bars for accurate trend signals.
- Blue bars indicate bullish trends; brown bars indicate bearish trends.
- Customizable look back period, multiplier, and channel shift.
- Provides clear buy and sell signals for scalping and day trading.
- Effective during volatile trading sessions for stronger trends.
- Plots directly below the main price chart for easy monitoring.
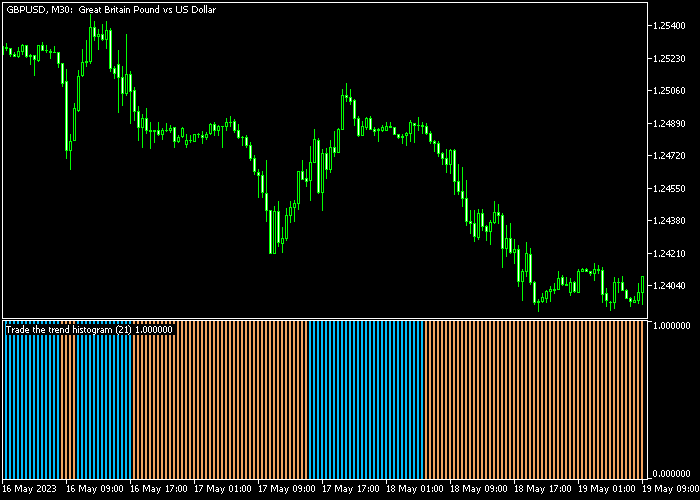
Indicator Chart
The Trading the Trend Histogram indicator appears in a separate panel below the main price chart.
Blue bars show bullish momentum, while brown bars indicate bearish momentum.
Traders can use the first appearance of each colored bar to identify entry points, and monitor bar color changes for potential reversals or exits.

Guide to Trade with Trading the Forex Trend Histogram Indicator
Buy Rules
- Wait for the first blue histogram bar to appear.
- This signals the start of an upward trend.
- Open a buy trade after the blue bar is confirmed.
- Focus on active trading sessions for stronger momentum.
Sell Rules
- Wait for the first brown histogram bar to appear.
- This signals the start of a downward trend.
- Open a sell trade after the brown bar is confirmed.
- Prefer high-volatility sessions for better trade performance.
Stop Loss
- For buy trades, set the stop slightly below the nearest support level.
- For sell trades, place the stop slightly above the nearest resistance level.
Take Profit
- Close trades at a predetermined profit target suitable for your strategy.
- Alternatively, exit when the histogram changes color (blue to brown or brown to blue).
Trend Histogram and Bollinger Bands Day Trading Strategy for MT5
This strategy combines the Trading the Trend Histogram Indicator with the Bollinger Bands Indicator to build a structured day trading system based on trend direction and volatility behavior.
The Trend Histogram Indicator provides momentum-based signals.
A first blue histogram bar signals bullish momentum and a buy setup, while a first brown histogram bar signals bearish momentum and a sell setup.
The Bollinger Bands Indicator defines market structure and volatility direction.
Rising bands indicate expanding bullish conditions and trend continuation, while falling bands indicate weakening price action and bearish pressure.
This strategy is designed for M15 and H1 charts where trends are clearer and false signals are reduced compared to lower timeframes.
Buy Entry Rules
- Wait for the first blue histogram bar on the Trend Histogram Indicator, confirming bullish momentum.
- Confirm that Bollinger Bands are rising, showing an upward trend environment.
- Enter a buy trade at the close of the confirmation candle or next candle open.
- Place stop loss below the most recent swing low or below the middle Bollinger Band.
- Close the trade when the histogram turns brown or when Bollinger Bands start flattening or turning downward.
Sell Entry Rules
- Wait for the first brown histogram bar on the Trend Histogram Indicator, confirming bearish momentum.
- Confirm that Bollinger Bands are falling, showing a downward trend environment.
- Enter a sell trade at the close of the confirmation candle or next candle open.
- Place stop loss above the most recent swing high or above the middle Bollinger Band.
- Close the trade when the histogram turns blue or when Bollinger Bands start flattening or turning upward.
Case Study 1: M15 Buy Trend Setup
On EURUSD M15, price moved out of a consolidation phase and Bollinger Bands started expanding upward, showing rising volatility and bullish structure.
At the same time, the Trend Histogram printed its first blue bar after a short pullback. A buy trade was entered at the close of that candle.
The stop loss was placed below the recent swing low and just under the middle Bollinger Band to allow for normal pullbacks within the trend.
Price continued moving upward with structured pullbacks, respecting the rising bands as dynamic support.
The buy trade was closed when the histogram turned brown, signaling weakening momentum.
Case Study 2: H1 Sell Trend Setup
On GBPJPY H1, Bollinger Bands started sloping downward after a rejection from a resistance zone, indicating bearish trend conditions.
The Trend Histogram then printed its first brown bar, confirming downside momentum. A sell trade was entered at candle close.
The stop loss was placed above the most recent swing high and slightly above the upper Bollinger Band to account for volatility spikes.
Price moved downward in a steady trend with small retracements.
The GBPJPY short trade was closed when the histogram switched back to blue, indicating a potential trend shift.
Download Now
Trading the trend – histogram.mq5 Indicator (MT5)
FAQ
How do I interpret consecutive histogram bars?
Multiple blue bars in a row indicate a strong upward trend, while consecutive brown bars suggest a strong downward trend.
The longer the sequence, the stronger the momentum.
Can this indicator be used for swing trading?
Yes. Although ideal for scalping and day trading, the histogram can also help identify trend direction for longer-term positions on higher timeframes.
Does the indicator repaint?
No. Once a histogram bar appears, its color is fixed, ensuring reliable signals and avoiding misleading late adjustments.
Which currency pairs perform best with this indicator?
Pairs with low spreads and higher volatility, such as EUR/USD, GBP/USD, and USD/JPY, tend to produce the most accurate and actionable signals.
Summary
The Trading the Forex Trend Histogram indicator delivers clear trend signals using blue and brown bars to identify bullish and bearish conditions.
Traders can use the first appearance of each color to time entries effectively and monitor bar sequences for trend strength.
Its non-repainting design ensures confidence in signals, while adjustable settings allow it to fit various instruments and timeframes.
The indicator is particularly useful for scalpers and day traders seeking to follow market momentum in active sessions.
By watching bar colors and sequences, traders can make informed entry and exit decisions, taking advantage of both short-term trends and potential reversals efficiently.


