About the Trend Lines Crossing Indicator
The Trend Lines Crossing Indicator for MT5 is built to detect breakout opportunities using dynamic support and resistance trend lines.
It automatically draws key trend boundaries on any selected time frame, helping traders focus on decisive price levels.
The sea-green line represents resistance, while the red line represents support.
When price closes above the resistance line, it signals bullish strength.
When price closes below the support line, it signals bearish pressure.
This breakout-based approach allows traders to participate in momentum-driven market moves.
You can customize the resistance and support line colors to match your chart setup.
The indicator works across all currency pairs and adapts well to both intraday and swing trading strategies.
Free Download
trendlinescrossing.mq5 Indicator (MT5)
Key Features
- Automatically plots resistance and support trend lines.
- Buy signal on breakout above the sea-green resistance line.
- Sell signal on breakout below the red support line.
- Customizable trend line colors.
- Designed for breakout and momentum traders.
Indicator Chart
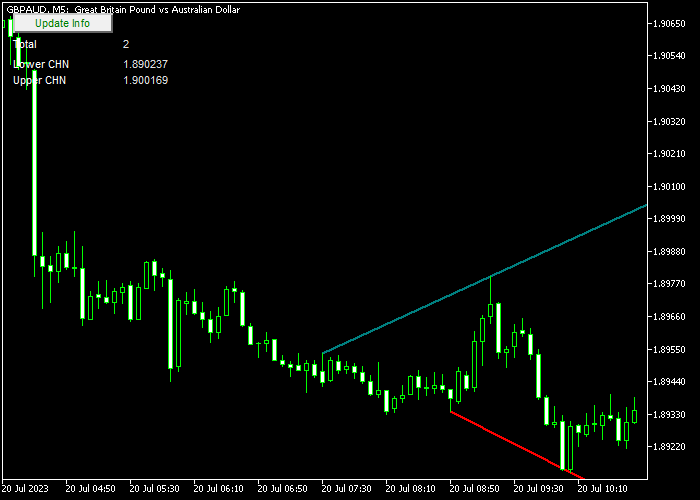
The Trend Lines Crossing indicator appears directly on the main price chart.
The sea-green line marks resistance, while the red line marks support.
Traders monitor candle closes beyond these lines to identify breakout buy and sell opportunities.

Guide to Trade with Trend Lines Crossing Indicator
Buy Rules
- Wait for a candle to close above the sea-green resistance trend line.
- Enter a buy trade after the breakout candle confirms strength.
- Ensure the breakout is supported by strong momentum.
- Avoid buying if price immediately falls back below the resistance line.
Sell Rules
- Wait for a candle to close below the red support trend line.
- Enter a sell trade after the breakout candle confirms weakness.
- Confirm that selling pressure is increasing at the breakout point.
- Avoid selling if price quickly moves back above the support line.
Stop Loss
- For buy trades, place the stop loss below the most recent support level.
- For sell trades, place the stop loss above the most recent resistance level.
- You may also position the stop on the opposite side of the broken trend line.
- Adjust the stop as price continues in your favor.
Take Profits
- Set a predefined profit target based on recent price swings.
- For buy trades, target the next significant resistance zone.
- For sell trades, target the next significant support zone.
Download Now
trendlinescrossing.mq5 Indicator (MT5)
FAQ
Which time frame is best for breakout trading?
Higher time frames often produce stronger breakout moves, while lower time frames generate more frequent signals.
Can this indicator be combined with other tools?
Yes. Many traders combine it with momentum indicators or volume analysis to confirm breakout strength.
Can I change the appearance of the trend lines?
You can customize the resistance and support line colors to match your chart template and personal preferences inside the MT5 settings panel.
Can I use the indicator for early breakout entries?
The safest approach is to wait for a full candle close beyond the trend line. Aggressive traders may enter during the breakout candle, but confirmation reduces false signals.
Summary
The Trend Lines Crossing indicator helps traders capture breakout opportunities using dynamic support and resistance lines.
Candle closes above resistance or below support provide direct trading signals aligned with momentum.
Its simple logic, customizable design, and adaptability across time frames make it a practical tool for traders who focus on breakout strategies and trend continuation moves.


