
About the Trade Time Indicator
The Trade Time indicator for MT5 is designed to capture breakout opportunities during specific trading hours.
It draws a time-based box around price action between your selected start and stop times.
This allows traders to focus on key market sessions and prepare for potential volatility expansion.
Once the session ends, the high and low of the box act as breakout levels.
A candle close above the upper boundary signals bullish momentum.
A candle close below the lower boundary signals bearish pressure.
When combined with the 200 EMA, traders can filter trades in the direction of the dominant trend.
The indicator allows full customization of session time, box colors, and fill settings.
It works on all MT5 time frames and trading instruments, making it suitable for London, New York, or Asian session breakout strategies.
Free Download
trade_time.mq5 Indicator (MT5)
Key Features
- Draws a time-based price box between selected hours.
- Highlights the session high and low breakout levels.
- Buy signal on candle close above the box high.
- Sell signal on candle close below the box low.
- Works effectively with the 200 EMA for trend filtering.
- Customizable time and visual settings.
Indicator Chart
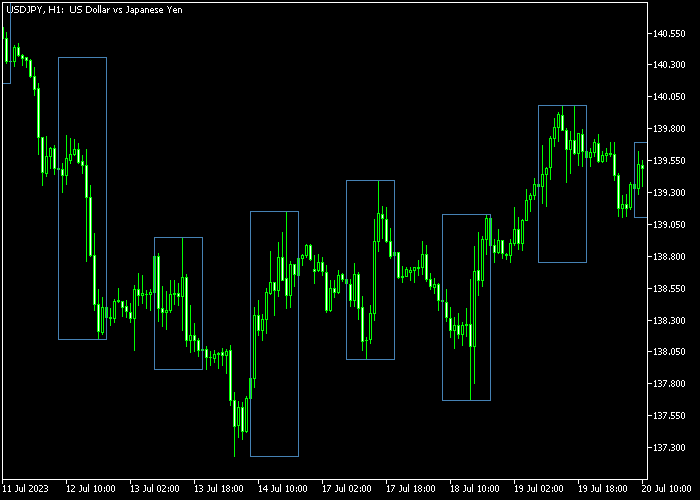
The Trade Time indicator appears on the main chart as a rectangular box marking a defined trading session.
The upper boundary represents resistance formed during that period, while the lower boundary represents support.
Traders monitor breakouts beyond these levels and confirm direction using the 200 EMA.
Guide to Trade with Trade Time Indicator
Buy Rules
- Wait for a candle to close above the previous session box high.
- Ensure price is trading above the 200 EMA.
- Confirm that the 200 EMA is sloping upward.
- Avoid buying if price is too extended from the EMA.
Sell Rules
- Wait for a candle to close below the previous session box low.
- Ensure price is trading below the 200 EMA.
- Confirm that the 200 EMA is sloping downward.
- Avoid selling if price is too extended from the EMA.
Stop Loss
- For buy trades, place the stop loss below short-term support inside the box.
- For sell trades, place the stop loss above short-term resistance inside the box.
- You may also use the opposite side of the box as a reference.
- Adjust stops as the trade progresses beyond the breakout level.
Take Profits
- Target a fixed risk-to-reward ratio such as 1:2.
- For buy trades, aim for the next higher resistance zone.
- For sell trades, aim for the next lower support zone.
- Alternatively, trail profits along the 200 EMA direction.
Trade Time MT5 and Triangular Moving Average Scalping Strategy
This session-based scalping strategy focuses on high-probability breakout moves during the most active market hours.
It combines the Trade Time Forex Indicator for MT5 with the Triangular Moving Average Indicator for MT5.
The goal is to trade session breakouts in the direction of the underlying trend.
The Trade Time indicator highlights previous session ranges.
A candle close above the previous session box high signals a bullish breakout. A close below the session low signals a bearish breakout.
The Triangular Moving Average confirms direction using a smooth trend line.
The medium sea green line shows a bullish trend while the deep pink line indicates bearish pressure.
This smoothing helps filter noise and keeps focus on the real trend.
This strategy is designed for the London and New York sessions on the M5 timeframe.
It works best on major pairs like EUR/USD and GBP/USD where volatility is strong.
Buy Entry Rules
- Wait for the candle to close above the previous session high box during the London or New York session.
- Confirm that the Triangular Moving Average is medium sea green, indicating a bullish trend.
- Enter a buy trade on the next candle after the breakout.
- Place the stop loss just below the breakout candle or inside the session box.
- Set take profit at a fixed risk to reward ratio of 1:1.5 or close when the TMA line turns deep pink.
Sell Entry Rules
- Wait for the candle to close below the previous session low box during the London or New York session.
- Confirm that the Triangular Moving Average is deep pink, indicating a bearish trend.
- Enter a sell trade on a small pullback after the breakout instead of immediately.
- Place the stop loss above the breakout zone or above the previous session high.
- Set take profit at the next intraday support or close when the TMA line shifts to medium sea green.
Case Study 1: London Session Breakout on EUR/USD
During the London open on M5, EUR/USD broke above the previous session high with a strong bullish candle.
The Triangular Moving Average was already medium sea green, confirming upward momentum.
A buy trade was entered on the next candle.
The stop loss was placed just inside the session box to keep risk tight. Price continued rising as volatility increased.
The trade was closed at a 1:1.5 target, capturing a clean session breakout.
Case Study 2: New York Session Reversal Breakout on GBP/USD
In the New York session, GBP/USD dropped below the previous session’s low after a period of consolidation.
The Triangular Moving Average was deep pink, confirming bearish direction.
Instead of entering immediately, a small retracement occurred, offering a better entry.
A sell trade was placed after the pullback.
The stop loss was set above the session range high for extra protection. Price moved lower with momentum.
The position was closed near a support level, securing a quick scalping profit.
Download Now
trade_time.mq5 Indicator (MT5)
FAQ
Why combine the indicator with the 200 EMA?
The 200 EMA helps identify the dominant market trend. Trading in its direction increases the probability of successful breakouts.
Which session works best with this indicator?
Many traders focus on the London or New York sessions because they often generate higher volatility and stronger breakout moves.
Can I use it on lower time frames?
Yes. It works well on M5 and M15 charts for intraday trading, as well as on higher time frames for broader session analysis.
Does the box repaint after the session ends?
Once the session closes, the box high and low remain fixed, providing stable breakout reference levels.
Summary
The Trade Time indicator helps traders capture session-based breakouts by defining clear time ranges.
When combined with the 200 EMA, it filters trades in the direction of the dominant trend.
This approach allows traders to focus on high-probability breakout windows and align entries with overall market momentum across all major currency pairs.


