
About the Waddah Attar Adx Bollinger Indicator
The Waddah Attar Adx Bollinger indicator for MT5 combines the strength measurement of the ADX with the volatility signals of Bollinger Bands.
This combination helps traders detect when market momentum begins to expand and when a new directional move may start.
The indicator displays colored histogram bars that reflect bullish or bearish pressure.
Green bars represent bullish momentum building in the market, while red bars signal growing bearish pressure.
By combining trend strength with volatility behavior, the indicator highlights moments when price activity starts accelerating.
Traders can use these signals to enter trades earlier during emerging moves rather than reacting late after a trend already develops.
Free Download
Key Features
- Combines ADX trend strength with Bollinger Bands volatility behavior.
- Displays momentum shifts using green and red histogram bars.
- Helps identify early bullish or bearish momentum expansion.
- Customizable inputs including ADX period and Bollinger period.
- Supports different applied price settings for fine tuning.
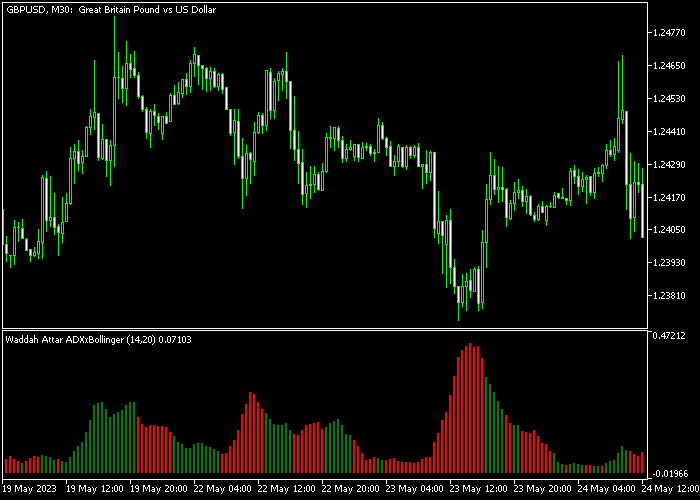
Indicator Chart
The Waddah Attar Adx Bollinger indicator shows colored histogram bars beneath the main price area.
Green bars indicate increasing bullish momentum while red bars signal rising bearish pressure.
Traders use the first color change in the sequence to identify potential buy or sell opportunities as momentum begins shifting in the market.
Guide to Trade with Waddah Attar Adx Bollinger
Buy Rules
- Identify the first green histogram bar appearing after the red bars.
- Confirm that bullish momentum begins expanding.
- Open a buy position at the start of the new bullish sequence.
- Monitor the histogram for continued green momentum.
Sell Rules
- Identify the first red histogram bar appearing after the green bars.
- Confirm that bearish momentum begins strengthening.
- Open a sell position as the bearish sequence begins.
- Watch for continued red bars to maintain the trade direction.
Stop Loss
- Place the stop loss below the most recent support level for buy trades.
- Place the stop loss above the nearest resistance level for sell trades.
Take Profit
- Close the buy trade when a new red histogram bar appears.
- Close the sell trade when a new green histogram bar appears.
- Trail profits if the momentum sequence continues.
Waddah Attar ADX Bollinger and Super Trend Hull Scalping Strategy for MT5
This scalping strategy combines the Waddah Attar ADX Bollinger Indicator with the Super Trend Hull Indicator to create a fast intraday system designed for M1 and M5 charts.
The goal is to capture short momentum bursts between 10 and 25 pips while staying aligned with strong directional trends.
The Waddah Attar ADX Bollinger indicator measures both volatility and momentum expansion.
Green histogram bars indicate bullish pressure and the start of an upward expansion phase, while red bars signal bearish momentum and increasing selling pressure.
The Super Trend Hull indicator defines trend direction using a smooth adaptive line.
A green line shows bullish trend conditions while a violet line confirms bearish trend structure.
When both indicators align, the probability of a strong continuation move increases significantly, especially in fast-moving scalping environments.
This strategy is ideal for major forex pairs such as EURUSD, GBPUSD, USDJPY, AUDUSD, and also gold (XAUUSD) during London and New York sessions when volatility is highest.
Buy Entry Rules
- Wait for Waddah Attar histogram to turn green and expand, confirming bullish momentum buildup.
- Confirm that the Super Trend Hull line is green, indicating bullish trend structure.
- Enter a buy trade after a minor pullback while price remains above the Super Trend Hull line.
- Place the stop loss below the most recent micro swing low or just under the Hull trend line depending on volatility.
- Target 10 to 25 pips or exit when Waddah Attar histogram begins shrinking or turns red.
Sell Entry Rules
- Wait for Waddah Attar histogram to turn red and expand, confirming bearish momentum expansion.
- Confirm that the Super Trend Hull line is violet, indicating bearish trend structure.
- Enter a sell trade after a small retracement while price remains below the Hull line.
- Place the stop loss above the most recent swing high or just above the Hull trend line depending on volatility.
- Target 10 to 25 pips or exit when Waddah Attar histogram turns green or loses strength.
Case Study 1: EURUSD M1 Scalping Buy
During the London open on EURUSD M1, price broke out of a short consolidation phase and started forming higher micro highs.
The Waddah Attar histogram quickly turned green and expanded, showing strong bullish momentum entering the market.
At the same time, the Super Trend Hull line flipped to green and started following price from below.
A buy trade was entered after a small pullback to the Hull line where price held support and confirmed continuation.
The stop loss was placed just under the Hull line rather than a fixed pip distance, allowing flexibility for minor volatility spikes.
Price moved upward in a fast impulsive sequence and reached the 10 to 25 pip range efficiently.
The trade was closed exactly when the Waddah Attar histogram began shrinking and turned from green to red, signaling that bullish momentum had exhausted and a short term reversal phase was starting.
Case Study 2: GBPJPY M5 Scalping Sell
On GBPJPY M5 during the New York session, price pushed into a resistance area and failed to break higher.
The Waddah Attar histogram turned red and expanded strongly, indicating increasing bearish pressure.
The Super Trend Hull line also flipped to violet, confirming bearish trend alignment.
A sell trade was taken after a minor retracement into the Hull line where price rejected and continued downward.
The stop loss was placed above the most recent swing high instead of directly above the Hull line to account for GBPJPY volatility.
Price dropped quickly in a clean expansion phase and reached the 10 to 25 pip target zone.
The sell trade was closed precisely when the Waddah Attar histogram turned green and price began to lose bearish structure, signaling that downward momentum had ended.
Download Now
FAQ
What does the Waddah Attar Adx Bollinger indicator measure?
The indicator measures market momentum by combining trend strength from ADX with volatility behavior from Bollinger Bands.
This allows traders to identify moments when price momentum starts accelerating.
Which settings can be customized?
Traders can modify several inputs including the ADX period, Bollinger Bands period, and the applied price used for calculations.
When does the indicator perform best?
The indicator performs best when the market begins expanding after a consolidation phase.
During these moments, the momentum and volatility combination help highlight the start of stronger directional movements.
Summary
The Waddah Attar Adx Bollinger indicator provides a practical way to combine momentum and volatility analysis into one trading tool.
By displaying colored histogram bars that represent bullish and bearish pressure, traders can quickly identify when momentum begins shifting in the market.
This approach helps traders react to early stages of potential trends instead of waiting for price moves that have already traveled a large distance.
Used together with support and resistance or broader trend analysis, it can improve trade timing and overall market awareness.


