
About the Waddah Attar Pivot V2 Indicator
The Waddah Attar Pivot V2 Indicator for MT5 provides dynamic pivot points that help traders identify key support and resistance levels for trend-based entries and exits.
It plots three colored pivot lines on the main chart: purple for long-term, orange for medium-term, and blue for short-term pivots.
These pivot lines update daily, allowing traders to follow the overall market trend and anticipate potential reversal zones.
Candles positioned above the long-term purple pivot indicate a bullish market, while candles below it indicate bearish conditions.
The indicator’s inputs are customizable, including time frames and line colors, so you can adapt it to your trading style.
It is lightweight and suitable for all MT5-supported instruments, making it a practical tool for trend-following strategies.
Free Download
Waddah_Attar_Pivot_V2.mq5 Indicator (MT5)
Key Features
- Three pivot point lines for long-, medium-, and short-term trends.
- Purple line marks long-term pivot levels for trend direction.
- Orange and blue lines track medium- and short-term pivot levels.
- Dynamic updates of pivot levels every day.
- Customizable timeframes and colors for flexibility.
- Lightweight and easy to integrate into any trading setup.
Indicator Chart
The Waddah Attar Pivot V2 Indicator displays three dynamic pivot lines on the main chart.
Candles above the purple pivot indicate bullish conditions, while candles below it indicate bearish conditions.
The medium- and short-term lines provide finer levels for potential entries, exits, and swing monitoring.
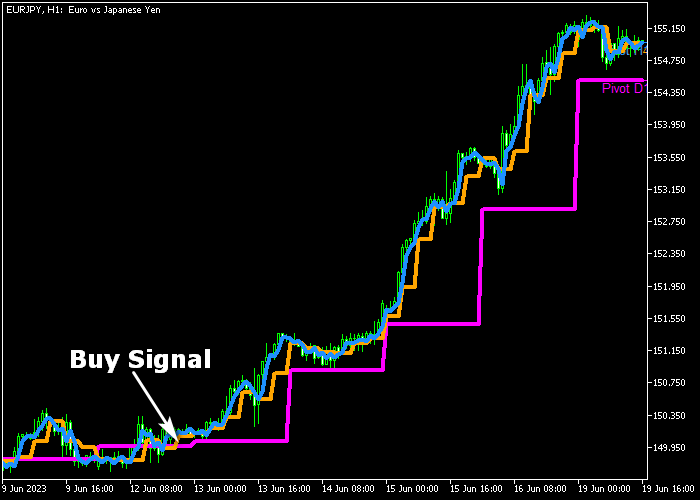
Guide to Trade with Waddah Attar Pivot V2 Indicator
Buy Rules
- Wait for the candles to cross above the purple long-term pivot line from below.
- Confirm that the bullish trend aligns with medium- and short-term pivot lines.
- Enter a buy trade once upward momentum is evident.
- Ensure the overall market trend supports bullish continuation.
Sell Rules
- Wait for the candles to cross below the purple long-term pivot line from above.
- Confirm that the bearish trend aligns with medium- and short-term pivot lines.
- Enter a sell trade once downward momentum is evident.
- Ensure the overall market trend supports bearish continuation.
Stop Loss
- For buy trades, place the stop below the previous swing low region.
- For sell trades, place the stop above the previous swing high region.
- Adjust the stop to recent market swings and volatility.
- Use swing levels to avoid premature exits.
Take Profit
- Target a minimum risk-to-reward ratio of 2.0 for all trades.
- Alternatively, close trades at predetermined profit levels set by your strategy.
- Adjust take profit based on pivot line proximity and trend strength.
- You can also trail profits following medium- or short-term pivot lines.
Waddah Attar Pivot V2 Swing Strategy for MT5
This swing trading strategy combines the Waddah Attar Pivot V2 Indicator with the RSI Adaptive T3 Filtered Indicator to identify strong directional moves and hold positions over longer price swings.
It focuses on aligning key pivot levels with filtered momentum signals to avoid noise and improve trade quality.
The Waddah Attar Pivot V2 indicator highlights important pivot zones that act as dynamic support and resistance.
The RSI Adaptive T3 Filtered indicator refines momentum signals using smoothing techniques.
A green filled line indicates buying pressure, while a red filled line shows selling pressure.
This filtering helps remove weak signals and keeps traders focused on stronger moves.
This strategy works best on H1, H4, and Daily charts.
It suits swing traders who prefer fewer trades with higher probability and are willing to hold positions for extended moves.
Buy Entry Rules
- Wait for the candle to close above the purple long term pivot line.
- Confirm that the RSI Adaptive T3 Filtered indicator shows a green filled line.
- Enter a buy trade at the opening of the next candle.
- Place a stop loss below the pivot line or below the recent swing low.
- Take profit when the RSI line turns red or at the next key resistance zone.
Sell Entry Rules
- Wait for the candle to close below the purple long term pivot line.
- Confirm that the RSI Adaptive T3 Filtered indicator shows a red filled line.
- Enter a sell trade at the opening of the next candle.
- Place a stop loss above the pivot line or above the recent swing high.
- Take profit when the RSI line turns green or at the next key support zone.
Case Study 1: EURUSD H4 Buy Swing
On EURUSD H4, price closed above the purple long term pivot line after a period of consolidation.
This confirmed a shift into a bullish environment.
At the same time, the RSI Adaptive T3 Filtered indicator turned green, showing strong buying pressure.
A buy trade was entered at the next candle. The stop loss was placed just below the pivot level.
Price continued to move upward over several candles, forming higher highs and higher lows.
The trade was held as long as the RSI remained green.
It was closed when the RSI turned red near a resistance zone, capturing a clean swing move.
Case Study 2: GBPJPY H1 Sell Swing
On GBPJPY H1, price dropped below the purple long term pivot line after failing to hold above resistance.
This signaled a bearish shift in market structure.
Shortly after, the RSI Adaptive T3 Filtered indicator turned red, confirming selling pressure.
A sell trade was opened at the next candle. The stop loss was placed above the pivot level.
Price continued to decline steadily, forming lower highs along the way.
The swing position was held as long as the RSI remained red.
The trade was closed when the RSI turned green near a support level, gaining a 110 pip swing profit.
Download Now
Waddah_Attar_Pivot_V2.mq5 Indicator (MT5)
FAQ
What do the three pivot lines represent?
Purple shows long-term trend pivots, orange shows medium-term, and blue shows short-term pivot levels.
They help identify trend direction and potential entry or exit zones.
How does the indicator show trend direction?
Candles above the long-term purple pivot suggest bullish momentum, while candles below it indicate bearish conditions.
Short-term pivots refine entry and exit points.
Can I adjust the pivot lines?
Yes. You can change the time frames and colors for each pivot line to suit your trading preferences and chart style.
Summary
The Waddah Attar Pivot V2 Indicator offers dynamic pivot points that clearly define trend direction and key levels for trade entries and exits.
Its daily-updating long-, medium-, and short-term lines help traders align with market momentum and monitor potential reversal zones.
With flexible settings and intuitive visual signals, it is a practical tool for improving precision in trend-following strategies and enhancing trading decision-making across multiple instruments.


