About the Weekly Fibo Levels Indicator
The Weekly Fibo Levels indicator for MT5 calculates and displays weekly Fibonacci pivot points along with key support and resistance levels.
It is designed for longer-term traders who prefer higher timeframes such as H1, H4, D1, or W1.
Candles closing above the weekly pivot suggest bullish momentum, while candles closing below indicate bearish pressure.
These levels assist traders in identifying trend direction and potential entry and exit points.
The indicator is fully customizable, allowing users to select how many past weeks to display, colors, zero line style, and level styles.
Traders can use these pivot points together with support and resistance levels to place logical stop losses and take profits.
This approach improves trade management and helps capture favorable moves on longer-term charts.
Free Download
Weekly fibo levels.mq5 Indicator (MT5)
Key Features
- Automatically calculates weekly Fibonacci pivot points, support, and resistance levels.
- Supports higher timeframe trading (H1, H4, D1, W1).
- Customizable display: number of weeks, colors, zero line, and levels style.
- Helps identify bullish and bearish signals based on candle close relative to the pivot.
- Supports logical placement of stop loss and take profit orders.
- Easy-to-read visual layout for trend and trade decision support.
Indicator Chart
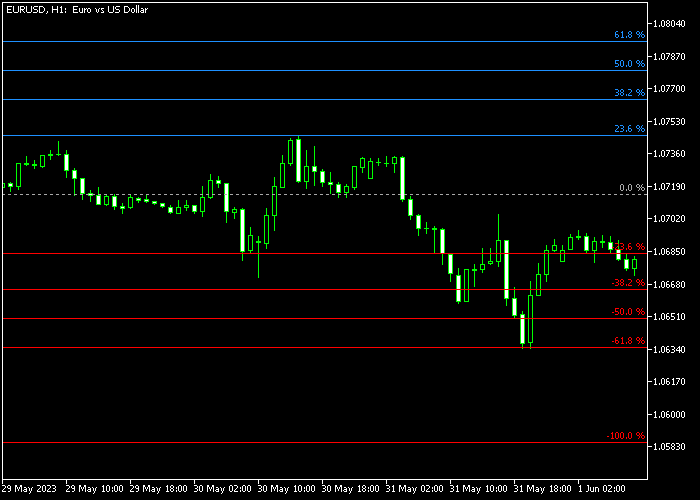
The Weekly Fibo Levels indicator is displayed directly on the price chart as pivot points with support and resistance lines.
The gray pivot line shows the weekly midpoint, while red lines indicate support and blue lines indicate resistance.
Traders can use these levels to determine trade direction, entry points, and logical exits based on market momentum and trend strength.

Guide to Trade with Weekly Fibo Levels Indicator
Buy Rules
- Wait for the candlestick to cross back above the gray pivot line from below.
- Confirm bullish momentum in price action.
- Open a buy trade when the pivot crossover occurs.
- Monitor price progression toward resistance levels for potential exit.
Sell Rules
- Wait for the candlestick to cross back below the gray pivot line from above.
- Confirm bearish momentum in price action.
- Open a sell trade when the pivot crossover occurs.
- Monitor price progression toward support levels for potential exit.
Stop Loss
- For buy trades, place a stop loss below one of the red support levels.
- For sell trades, place a stop loss above one of the blue resistance levels.
- Reassess stops if price moves strongly against the pivot level.
Take Profit
- Close buy trades near any of the blue resistance levels.
- Close sell trades near any of the red support levels.
- Partial exits can secure gains if price approaches multiple levels.
- Follow pivot and support/resistance interactions for optimal exits.
Weekly Fibo Levels Indicator MT5 Swing Strategy with Arrows Alert Confirmation
This strategy combines the Weekly Fibo Levels Indicator with the Indicator Arrows Alert to build a structured swing trading approach for H1, H4, and Daily charts.
The Weekly Fibo Levels indicator helps define directional bias using the weekly structure.
This gives traders a clear weekly directional context before looking for entries.
The Indicator Arrows Alert tool provides timing confirmation.
A green arrow signals a buy opportunity, while a red arrow signals a sell opportunity.
This helps traders avoid entering too early and instead wait for a clear trigger aligned with the weekly bias.
This strategy works best on higher intraday and swing timeframes such as H1, H4, and Daily charts.
It is designed for traders who prefer fewer but higher-quality setups that follow the broader market structure.
Buy Entry Rules
- Confirm that price has crossed back above the gray pivot line from below, showing bullish weekly structure.
- Wait for a green arrow from the Indicator Arrows Alert system.
- Enter a buy trade at the close of the signal candle.
- Place the stop loss below the most recent swing low or below the gray pivot zone for added protection.
- Hold the trade as long as price stays above the pivot line and no red arrow appears.
- Exit when a red arrow appears or when price closes back below the gray pivot line.
Sell Entry Rules
- Confirm that price has crossed below the gray pivot line from above, showing bearish weekly structure.
- Wait for a red arrow from the Indicator Arrows Alert system.
- Enter a sell trade at the close of the signal candle.
- Place the stop loss above the most recent swing high or above the gray pivot zone for protection.
- Hold the trade as long as price stays below the pivot line and no green arrow appears.
- Exit when a green arrow appears or when price closes back above the gray pivot line.
Case Study 1: Buy Trade Example (EUR/USD H4)
Price moved back above the gray pivot line after a prior bearish phase, confirming a shift into bullish structure.
After a short consolidation above the pivot, a green arrow appeared from the Indicator Arrows Alert system, confirming a valid buy setup.
A long position was opened at the close of the signal candle with the stop loss placed below the recent swing low and under the pivot zone for extra safety.
The trade was managed while price remained above the gray pivot line.
As price continued upward, no opposing signals appeared, allowing the position to develop smoothly.
The trade was closed when a red arrow appeared near a resistance area, signaling weakening bullish momentum and a potential reversal.
Case Study 2: Sell Trade Example (GBP/JPY Daily)
Price crossed below the gray pivot line after previously holding above it, confirming a bearish shift in weekly structure.
After a brief retracement, a red arrow appeared from the Indicator Arrows Alert system, confirming a sell opportunity aligned with the new direction.
A short position was opened at the close of the signal candle with the stop loss placed above the recent swing high and above the pivot line.
The position remained active while price stayed below the gray pivot line.
Gradual downward movement continued with intermittent pullbacks that did not break the bearish structure.
The trade was closed when a green arrow appeared, indicating a shift in momentum and suggesting the bearish phase had ended.
Download Now
Weekly fibo levels.mq5 Indicator (MT5)
FAQ
How are the weekly Fibo levels calculated?
The indicator calculates pivot points, support, and resistance levels based on the previous week’s high, low, and close prices using Fibonacci ratios.
Which timeframes work best with this indicator?
Higher timeframes, such as H1, H4, D1, and W1 are ideal for using weekly Fibo levels.
It’s not intended for very short-term scalping charts.
Can I customize the levels and colors?
Yes, you can adjust how many past weeks are shown, line colors, zero line style, and the style of the support and resistance levels.
How can I use this indicator for stop loss and take profit?
Support and resistance levels provide logical stop loss and take profit points.
Stops can be placed below support for buys and above resistance for sells, while profit targets can align with opposite levels.
Summary
The Weekly Fibo Levels indicator is a powerful tool for longer-term traders seeking reliable pivot points and key support and resistance levels.
It simplifies trend detection with clear bullish and bearish signals and assists with logical trade management.
Customizable settings and visual clarity make it easy to use across higher timeframes, allowing traders to make informed entry, stop loss, and take profit decisions.


