
About the EMA Levels Indicator
The EMA Levels Indicator for MT5 is a beginner-friendly trend-following tool that uses exponential moving averages to display current market conditions.
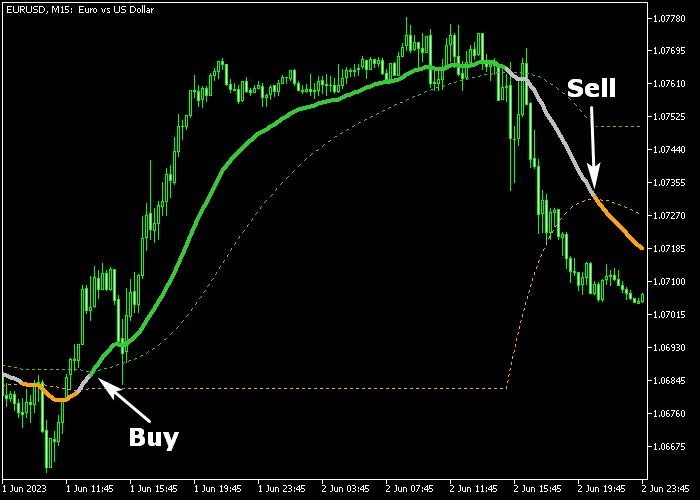
It plots a thick colored signal line directly on the price chart, helping traders quickly identify bullish, bearish, or neutral trends.
Green thick lines indicate an uptrend, signaling potential buy opportunities.
Orange thick lines indicate a downtrend, signaling potential sell opportunities.
Gray thick lines mark neutral market conditions, helping traders avoid uncertain periods.
Inputs such as EMA period, line colors, and style are fully customizable.
Free Download
Ema levels.mq5 Indicator (MT5)
Key Features
- Displays trend direction using colored EMA lines directly on the price chart.
- Provides clear buy, sell, and neutral trend signals.
- Customizable EMA period, line colors, and style.
- Suitable for all currency pairs and trading instruments.
- Helps traders follow trends without complicated analysis.
Indicator Chart
The EMA Levels Indicator shows green, orange, and gray thick lines on the chart to represent bullish, bearish, and neutral trends.
Traders can instantly identify the prevailing trend and time entries according to the color signals.
Guide to Trade with EMA Levels Indicator
Buy Rules
- Wait for the thick green line to appear on the chart.
- Open a buy position at the opening of the next candle after the signal line appears.
- Focus on entries where the green line remains above the previous trend points.
Sell Rules
- Wait for the thick orange line to appear on the chart.
- Open a sell position at the opening of the next candle after the signal line appears.
- Focus on entries where the orange line remains below the previous trend points.
Stop Loss
- For buy trades, place the stop slightly below the green dotted line or the nearest swing low.
- For sell trades, place the stop slightly above the orange dotted line or the nearest swing high.
Take Profit
- Close buy positions if the thick orange line appears on the chart.
- Close sell positions if the thick green line appears on the chart.
- Partial profits can be taken at intermediate support/resistance levels for added security.
- Optionally trail positions along the EMA line to capture extended trend moves.
EMA Levels with MA Ribbon Indicator Scalping Strategy for MT5
This scalping strategy combines the EMA Levels Indicator with the MA Ribbon Signal Indicator to capture fast intraday moves with clear trend alignment.
It is designed for M1, M5, and M15 charts where price reacts quickly to short-term momentum shifts.
The EMA Levels indicator provides directional bias through color changes.
The MA Ribbon Signal indicator confirms trend strength using a colored ribbon: blue indicates a bullish market and orange indicates a bearish trend.
Together, they help filter trades in the direction of the dominant intraday momentum.
This strategy works best during the London and New York sessions when volatility is high and scalping opportunities appear frequently on major pairs and Gold.
Buy Entry Rules
- Wait for the EMA Levels indicator to turn green, confirming a buy signal.
- Confirm that the MA Ribbon Signal is blue, indicating a bullish trend.
- Enter a buy trade at the close of the confirmation candle.
- Place the stop loss below the most recent swing low or below the ribbon structure.
- Take profit between 8 and 30 pips, depending on volatility and nearby resistance zones.
Sell Entry Rules
- Wait for the EMA Levels indicator to turn orange, confirming a sell signal.
- Confirm that the MA Ribbon Signal is orange, indicating a bearish trend.
- Enter a sell trade at the close of the confirmation candle.
- Place the stop loss above the most recent swing high or above the ribbon structure.
- Take profit between 8 and 30 pips, depending on volatility and nearby support zones.
Case Study 1 Buy Trade (GBPUSD, M15)
During the London session on GBPUSD using the M5 timeframe, the EMA Levels indicator turned green, signaling a buy opportunity.
At the same time, the MA Ribbon Signal turned blue, confirming bullish trend alignment.
A buy trade was opened at the candle close. Price moved upward in a steady intraday push.
The trade was closed for +31 pips when price reached a short-term resistance area and the MA Ribbon started to flatten, indicating reduced upside continuation.
Case Study 2 Sell Trade (EURJPY, M5)
During the New York session on EURJPY using the M5 timeframe, the EMA Levels indicator turned orange, signaling bearish pressure.
The MA Ribbon Signal also turned orange, confirming a downward trend.
A sell trade was executed at the close of the signal candle. Price dropped steadily over several candles.
Unfortunately, the trade was closed for a 16 pip loss when price hit a support zone and the EMA Levels line switched back to green, signaling a potential reversal.
Download Now
Ema levels.mq5 Indicator (MT5)
FAQ
What do the different EMA line colors indicate?
Green represents a bullish trend, orange indicates a bearish trend, and gray signals a neutral or sideways market.
How can beginners use the EMA Levels Indicator?
Traders can follow the colored lines to determine the current trend and enter trades in the direction of the signal without complex calculations.
Can it be used for scalping on M1?
Yes, the indicator can be applied to M1 charts for quick intraday scalping, especially on low-spread currency pairs during active trading sessions.
Can it be combined with other indicators?
Yes, it works well alongside oscillators, support/resistance levels, or momentum tools to enhance trade confirmations and entry decisions.
Summary
The EMA Levels Indicator provides clear visual trend signals using colored EMA lines, making trend-following trades easier to spot.
Green, orange, and gray lines help traders distinguish bullish, bearish, and neutral periods.
By entering trades in alignment with the EMA signal line and monitoring trend changes for exit, traders can maintain a systematic approach to trend trading.
It is particularly useful for beginners and those who want a simple, effective trend-following tool.


