About the Fine Tuning MA Candle Indicator
The Fine Tuning MA Candle Indicator for MT5 is designed to help traders identify intraday buy and sell opportunities using a simple visual candle system.
Instead of relying on multiple indicators, this tool highlights potential trend direction directly within the price area using colored signal candles.
Blue candles highlight bullish conditions, while violet candles indicate bearish market pressure.
When the signal color changes, it often reflects a shift in momentum that may lead to a new trading opportunity.
The indicator works immediately after installation and requires minimal configuration.
Several inputs can still be adjusted if needed, including FTMA, rank levels, shift parameters, and color settings.
Day traders often prefer using this indicator during the London and New York sessions when volatility tends to increase.
Free Download
FineTuningMACandle.mq5 Indicator (MT5)
Key Features
- Blue candles indicate bullish market conditions.
- Violet candles highlight bearish momentum.
- Designed for simple intraday trading decisions.
- Works immediately without complex setup.
- Suitable for fast paced day trading strategies.
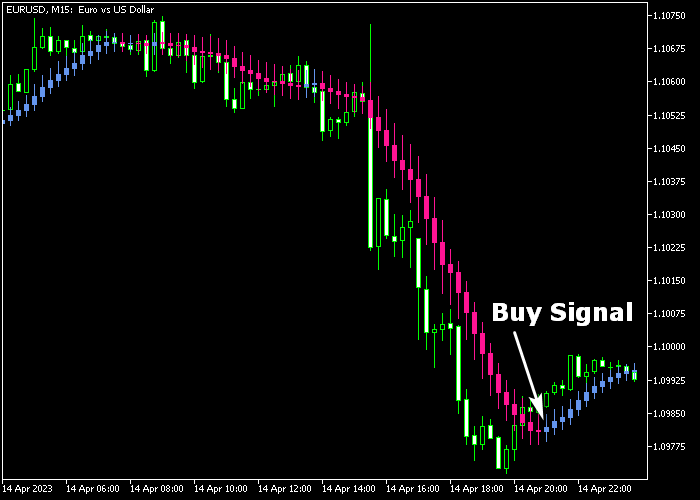
Indicator Chart
The Fine Tuning MA Candle indicator appears in the main price window and overlays blue and violet signal candles slightly above or below the normal price candles.
These colored signals help traders recognize shifts between bullish and bearish market phases.

Guide to Trade with Fine Tuning MA Candle Indicator
Buy Rules
- Wait for the first blue signal candle to appear on the platform.
- Confirm that bullish momentum begins building after the color change.
- Open a buy position once the blue candle forms.
- Ensure the market is not approaching a strong resistance level.
Sell Rules
- Wait for the first violet signal candle to appear.
- Confirm that bearish pressure starts developing.
- Open a sell position once the violet candle forms.
- Avoid entering trades directly into strong support levels.
Stop Loss
- Place the stop loss slightly below the blue signal candle for buy trades.
- Place the stop loss slightly above the violet signal candle for sell trades.
- Allow extra room for normal price fluctuations.
Take Profit
- Close all buy trades when the first violet signal candle appears.
- Close all sell trades when the first blue signal candle appears.
- Alternatively, exit trades at a fixed profit target.
Fine Tuning MA Candle with Aroon Indicator Scalping Strategy for MT5
This scalping strategy combines the Fine Tuning MA Candle Indicator with the Aroon Oscillator MTF Indicator to create a trend-following system that focuses on clean momentum continuation with structured entries.
The Fine Tuning MA Candle Indicator defines the short-term market direction using candle sequences.
Consecutive blue candles indicate a bullish trend with steady buying pressure. Consecutive violet candles indicate a bearish trend with sustained selling pressure.
The Aroon Oscillator MTF Indicator confirms trend strength and timing using directional zones.
A blue Aroon zone signals a buy opportunity and rising bullish strength. A brown zone signals a sell opportunity and increasing bearish pressure.
This combination helps confirm whether a trend is strong enough to trade or fading.
This strategy works best on M5 and M15 charts and is suitable for fast scalping during active market sessions when price movement is more directional and less choppy.
Buy Entry Rules
- Wait for consecutive blue candles on the Fine Tuning MA Candle Indicator, confirming bullish momentum.
- Wait for the Aroon Oscillator MTF Indicator to show a blue zone, confirming bullish strength.
- Enter a buy trade at the close of the confirmation candle.
- Set the stop loss below the most recent swing low or below the last violet candle support structure.
- Take profit when violet candles start forming or when the Aroon zone switches to brown.
Sell Entry Rules
- Wait for consecutive violet candles on the Fine Tuning MA Candle Indicator, confirming bearish momentum.
- Wait for the Aroon Oscillator MTF Indicator to show a brown zone, confirming bearish strength.
- Enter a sell trade at the close of the confirmation candle.
- Place a stop loss above the most recent swing high or above the last blue candle resistance structure.
- Take profit when blue candles start forming or when the Aroon zone switches to blue.
Case Study 1: GBPUSD M5 Buy Scalping Setup
On GBPUSD M5, price began forming consecutive blue candles after a small consolidation, showing early bullish momentum building in the market structure.
Shortly after, the Aroon Oscillator MTF Indicator shifted into a blue zone, confirming that bullish strength was increasing and trend conditions were supportive for buying.
A buy trade was entered at the close of the next blue candle after confirmation from both indicators aligned.
The stop loss was placed below the most recent swing low and under the last cluster of violet candles to protect against sudden pullbacks.
Price continued upward with short retracements but maintained a bullish structure.
2 hours later, the long trade was closed when violet candles began appearing again, signaling weakening momentum.
Case Study 2: USDJPY M15 Sell Scalping Setup
On USDJPY M15, price rejected a resistance area and started printing consecutive violet candles, confirming a shift into bearish momentum.
The Aroon Oscillator MTF Indicator then moved into a brown zone, confirming that selling pressure was strengthening and the trend was aligned downward.
A sell trade was entered at the close of a strong violet candle after both indicators confirmed the same direction.
The stop loss was placed above the recent swing high and just above the last blue candle zone to allow normal volatility.
Price moved downward in structured waves with small corrections while staying aligned with bearish conditions.
3 hours later, the short trade was closed when blue candles reappeared, indicating early reversal pressure.
Download Now
FineTuningMACandle.mq5 Indicator (MT5)
FAQ
Where does the indicator appear on the platform?
The indicator displays its colored signal candles directly in the main price window, slightly above or below the regular price candles.
What do the blue and violet candles represent?
Blue candles indicate bullish momentum while violet candles signal bearish market pressure.
Do I need to configure the indicator before using it?
No. The indicator works immediately after installation, although traders can adjust parameters such as FTMA, rank levels, shift values, and colors.
When does the indicator usually perform best?
Many traders prefer using it during the London and New York trading sessions because market volatility is typically higher during those periods.
Summary
The Fine Tuning MA Candle indicator provides a straightforward way to identify intraday trading opportunities using colored signal candles.
By displaying blue and violet candles directly in the price window, the indicator highlights changes in market momentum without requiring complicated analysis.
The signals can be used on their own or combined with support and resistance analysis for additional confirmation.
With flexible input parameters and a simple interpretation method, the indicator offers a practical solution for day traders who want a fast way to monitor market direction.


