About the Stochastic Histogram Forex Alert Indicator
The Stochastic Histogram Forex Alert indicator for MT5 generates buy and sell signals using a bar histogram based on the Stochastic oscillator.
It appears in a separate window below the main price area, allowing traders to easily monitor market momentum and trend direction.
Blue bars signal bullish momentum, while violet bars indicate bearish momentum.
Traders can use these color-coded bars to quickly enter trades in the direction of the market or anticipate reversals.
It also provides alerts when new bars appear, making it easier to act on trading opportunities without constantly watching the screen.
Inputs such as K period, D period, slowing, MA method, applied price, colors, and style can be customized to match different trading styles, instruments, and timeframes.
This tool works best during high-activity sessions like London and New York.
Free Download
Stochastic_Histogram_Alert.mq5 Indicator (MT5)
Key Features
- A colored bar histogram that signals buy and sell opportunities based on Stochastic readings.
- Blue bars indicate bullish conditions; violet bars indicate bearish conditions.
- Customizable Stochastic parameters for precise signal tuning.
- Alerts notify traders of new trading signals in real time.
- Ideal for short-term traders looking for fast, reliable entries.
Indicator Chart
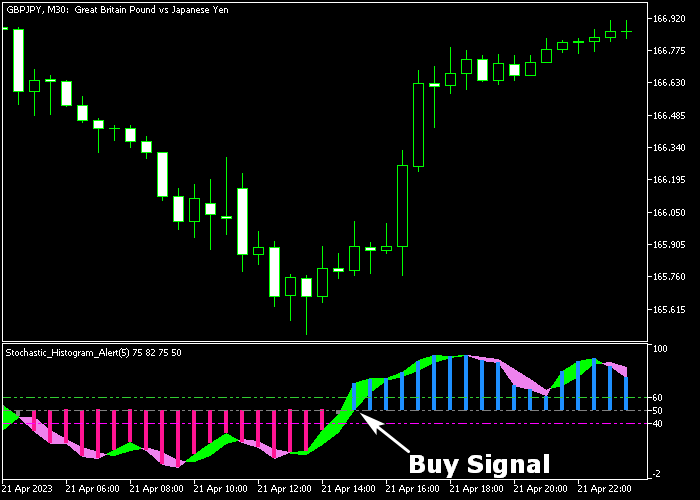
The indicator displays as colored bars in a separate window below the price chart.
Each bar represents the current momentum, with blue indicating upward movement and violet indicating downward movement.
Traders use the histogram to confirm trend direction and anticipate possible entry and exit points based on the color changes.

Guide to Trade with Stochastic Histogram Forex Alert Indicator
Buy Rules
- Wait for the histogram bars to cross the zero level from below and turn blue.
- Ensure the overall market trend is supportive of bullish momentum.
- Open a buy trade when the blue bar confirms the upward movement.
- Keep the trade open as long as bars remain blue, indicating continued bullish strength.
Sell Rules
- Wait for the histogram bars to cross the zero level from above and turn violet.
- Ensure the overall market trend is supportive of bearish momentum.
- Open a sell trade when the violet bar confirms the downward movement.
- Keep the trade open as long as bars remain violet, signaling continued bearish strength.
Stop Loss
- Place stop loss 2-3 pips below recent swing lows for buy trades.
- Place stop loss 2-3 pips above recent swing highs for sell trades.
- Base your stop placement on recent market swings rather than fixed distances.
- Keep risk per trade proportional to your account size and strategy.
Take Profit
- Close all buy trades as soon as the first violet histogram bar appears.
- Close all sell trades as soon as the first blue histogram bar appears.
- Monitor momentum strength to exit early if the trend begins to weaken.
- Optionally, use other indicators or trend confirmation tools to refine exits.
Stochastic Histogram Forex Alert Strategy for MT5
This day trading strategy combines the Stochastic Histogram Forex Alert Indicator with the Half Trend Alert Indicator to create a trend-following system for M5, M15, and H1 charts.
The Stochastic Histogram indicator converts traditional stochastic momentum into a histogram format, making trend shifts easier to read.
Blue histogram bars above the zero line signal bullish momentum, while violet bars below zero indicate bearish pressure.
This helps traders quickly identify whether momentum supports buying or selling conditions.
The Half Trend indicator is a directional trend system that filters market noise and follows sustained price movement.
It displays blue arrows and blue trend structure during bullish phases and red arrows with red structure during bearish phases.
This strategy works across M5 for quick trades, M15 for balanced intraday setups, and H1 for stronger trend confirmation.
The goal is to trade only when momentum and trend direction agree.
Buy Entry Rules
- Confirm that Half Trend shows a blue arrow and blue trend line, indicating a bullish market.
- Wait for the Stochastic Histogram to print a blue bar above the zero line.
- Enter a buy trade at the close of the signal candle when both conditions align.
- Place the stop loss below the most recent swing low or below the Half Trend line.
- Close the trade when Half Trend prints a red arrow or when the histogram turns violet below zero.
Sell Entry Rules
- Confirm that Half Trend shows a red arrow and red trend line, indicating a bearish market.
- Wait for the Stochastic Histogram to print a violet bar below the zero line.
- Enter a sell trade at the close of the signal candle when both conditions align.
- Set the stop loss above the most recent swing high or above the Half Trend line.
- Close the trade when Half Trend prints a blue arrow or when the histogram turns blue above zero.
Case Study 1: EURUSD M15 London Session Buy Trade
On EURUSD M15 during the London session, Half Trend printed a blue arrow after a clean breakout above a consolidation range, confirming a bullish shift.
Shortly after, the Stochastic Histogram printed a blue bar above zero, confirming momentum aligned with the trend.
A buy trade was opened at the close of the signal candle.
The stop loss was placed below the most recent swing low and just under the Half Trend support line to protect against sudden reversals.
The trade was closed when Half Trend switched to a red arrow and the histogram turned violet, showing that bullish momentum had fully weakened and sellers were taking control.
Case Study 2: GBPJPY H1 New York Session Sell Trade
On GBPJPY H1 during the New York session, Half Trend printed a red arrow after price failed to hold above a resistance zone, confirming bearish market direction.
The Stochastic Histogram followed with a violet bar below zero, confirming downside momentum.
A sell trade was opened at the close of the signal candle.
The stop loss was placed above the recent swing high and above the Half Trend resistance line to allow normal volatility.
The trade was closed when Half Trend flipped to a blue arrow and the histogram turned blue above zero, showing that bearish pressure had faded and a bullish reversal was starting to form.
Download Now
Stochastic_Histogram_Alert.mq5 Indicator (MT5)
FAQ
Which timeframes work best with this indicator?
The indicator works on all timeframes, but it is most effective on active, short-term charts where momentum changes occur frequently.
Can I customize the bar colors and Stochastic parameters?
Yes. Traders can adjust K and D periods, slowing, MA method, applied price, and bar colors to suit their trading preferences.
Does the indicator provide alerts for new signals?
Yes. Alerts notify you whenever a new buy or sell bar appears, making it easier to catch trading opportunities.
Is this indicator suitable for beginners?
Yes. The color-coded bars and clear signals make it simple to interpret market trends without complex analysis.
Summary
The Stochastic Histogram Forex Alert indicator gives traders a visual and actionable way to follow momentum using blue and violet bars.
By entering trades in the direction of the histogram and closing them when colors change, traders can efficiently align with market trends.
Customizable parameters, real-time alerts, and easy-to-read bars make it suitable for short-term trading strategies during high-activity sessions.
It provides a reliable tool for identifying market trends and executing trades with confidence.


