
About the Daily Range Projections Indicator
The Daily Range Projections Indicator for MT5 predicts the most likely trading range for the next day, providing high, low, and average price levels directly on the chart.
It works with any currency pair, instrument, or timeframe.
By analyzing past price data, the indicator identifies key zones where price is likely to reach or reverse.
The purple average daily price level is the central reference.
Price above it signals bullish sentiment, while price below indicates bearish conditions.
Traders can use these levels for structured entry and exit planning.
Inputs such as high, low, and average price projections can be customized to fine-tune the forecasts according to your trading style.
Free Download
dailyrangeprojections_full.mq5 Indicator (MT5)
Key Features
- Forecasts next-day high, low, and average prices.
- Identifies bullish or bearish sentiment based on the average line.
- Customizable projections for accuracy and style.
- Provides visual guidance for precise entry and exit levels.
- Supports both trend-following and reversal strategies.
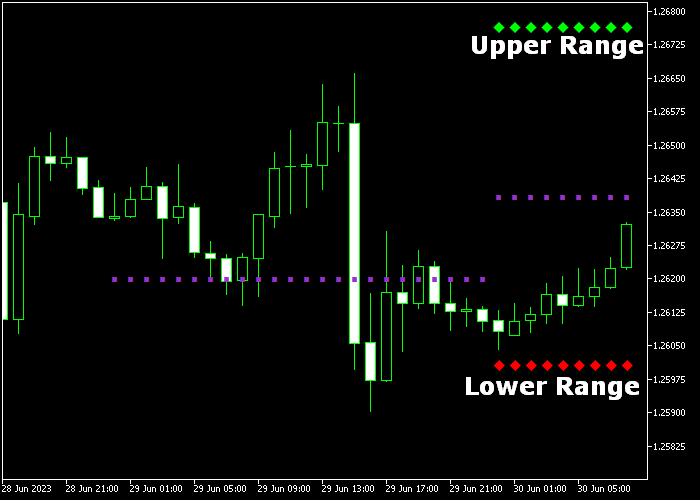
Indicator Chart
The Daily Range Projections Indicator overlays colored lines on the main chart.
The purple dotted line represents the average daily price.
Green lines indicate projected upper ranges, and red lines indicate projected lower ranges.
These levels help traders assess market sentiment and possible reversal points.
Guide to Trade with Daily Range Projections Indicator
Buy Rules
- Wait for a candle to close above the purple average daily price level.
- Confirm that the move aligns with an overall bullish sentiment.
- Enter a buy trade at the candle close or next candle open.
- Avoid entries if price approaches strong resistance near the projected upper range.
Sell Rules
- Wait for a candle to close below the purple average daily price level.
- Confirm that the move aligns with an overall bearish sentiment.
- Open a sell trade at the candle close or next candle open.
- Avoid selling near support close to the projected lower range.
Stop Loss
- For buy trades, place the stop loss below the previous swing low.
- For sell trades, place the stop loss above the previous swing high.
- Keep risk consistent with your money management rules.
Take Profit
- For buy trades, target the predicted upper green range level.
- For sell trades, target the predicted lower red range level.
- Consider scaling out profits if price struggles near the range boundary.
- Exit early if the market shows signs of reversal before reaching the target.
Daily Range Projections and Gann High Low Activator MT5 Scalping Strategy
This scalping strategy blends breakout confirmation with quick trend direction to capture short, aggressive moves during active sessions.
It uses the Daily Range Projections Forex Indicator to identify when price breaks key daily average levels and the Gann High Low Activator Indicator to confirm the short‑term trend direction.
Together, these indicators help you take high‑probability scalping trades on M1 and M5 charts.
This strategy is designed for very short‑term scalping during the London and New York sessions.
It works well on highly liquid currency pairs and can capture 7 to 20 pip moves when price breaks out with momentum on M1 and M5 timeframes.
Buy Entry Rules
- Confirm that the Gann Activator line is lime green, indicating bullish bias for the session.
- Wait for a candle to close above the purple average daily price level, signaling a bullish breakout.
- Enter a buy trade at the opening of the next candle after the breakout close.
- Place the stop loss a few pips below the breakout candle low or just under the average daily level.
- Take profit between 7 and 20 pips or exit early if the Gann Activator line turns orange, indicating a weakening trend.
Sell Entry Rules
- Confirm that the Gann Activator line is orange, indicating bearish bias for the session.
- Wait for a candle to close below the purple average daily price level, signaling a bearish breakout.
- Enter a sell trade at the next candle open after the breakout confirmation.
- Place the stop loss a few pips above the breakout candle high or just above the average daily level.
- Take profit between 7 and 20 pips or exit early if the Gann Activator line turns lime green.
Case Study 1: USD/JPY M1 Breakout Buy
During an active M1 session, USD/JPY held below the average daily price level before the Gann Activator line turned lime green, suggesting bullish momentum.
When a candle closed clearly above the purple level, a buy trade was placed at the next candle open.
The stop loss was situated just below the breakout candle low.
Price climbed quickly, and the position reached a 12 pip gain before the Gann line started to flatten, signaling it was time to exit.
Case Study 2: EUR/GBP M5 Breakout Sell
On the M5 chart, EUR/GBP spent time around the average daily level before the Gann Activator line turned orange, indicating a bearish bias.
A candle then closed below the purple daily range level, triggering a sell breakout.
A short trade was initiated at the next candle with the stop loss above the breakout candle high.
Price moved downward with momentum. Instead of waiting for opposite support, the trade exited when the Gann Activator line turned lime green again, securing a quick 15 pip move.
Download Now
dailyrangeprojections_full.mq5 Indicator (MT5)
FAQ
How does the indicator determine tomorrow’s range?
It analyzes historical price movements and calculates projected high, low, and average levels for the following trading day.
Can it be used on all timeframes?
Yes. The indicator is compatible with any timeframe, but intraday traders often use it on M15 to H1 charts for precise entry planning.
What does the purple line represent?
The purple line shows the average projected price for the next trading day and serves as the main reference for bullish or bearish sentiment.
Is it reliable for trend trading?
Yes. Traders can follow the projected direction based on price relative to the average line or combine it with other trend indicators for confirmation.
Summary
The Daily Range Projections Indicator for MT5 helps traders anticipate tomorrow’s price movement by showing high, low, and average levels.
Its clear visual zones make it easier to identify bullish and bearish sentiment and plan structured entries and exits.
Adjustable projections allow traders to match the tool to their preferred trading style and timeframe.


