About the Laguerre ROC indicator
The Laguerre ROC indicator for MT5 is a high-performance momentum oscillator that merges Laguerre smoothing logic with the Price Rate of Change (ROC) formula.
By combining these two technical concepts, the indicator filters out market noise while highlighting significant velocity shifts in price action.
It appears in a separate window as a dual-colored histogram that oscillates around a central zero level.
This setup allows traders to identify the strength and direction of the short-term trend with high precision.
It is specifically engineered to assist scalpers and day traders in entering the market at the exact moment momentum transitions from bearish to bullish or vice versa.
Free Download
laguerre_roc.mq5 Indicator (MT5)
Key Features
- Integrates Laguerre smoothing with Rate of Change logic for faster signal delivery.
- Uses a blue and orange histogram to visualize immediate market sentiment shifts.
- The zero-line crossover serves as an objective trigger for trade entries and exits.
- Includes adjustable averaging ratios to fine-tune the smoothness of the histogram.
- Provides overbought and oversold thresholds for identifying potential market exhaustion.
- Works as a stable standalone tool or a filter for broader trend-following strategies.
Indicator Chart
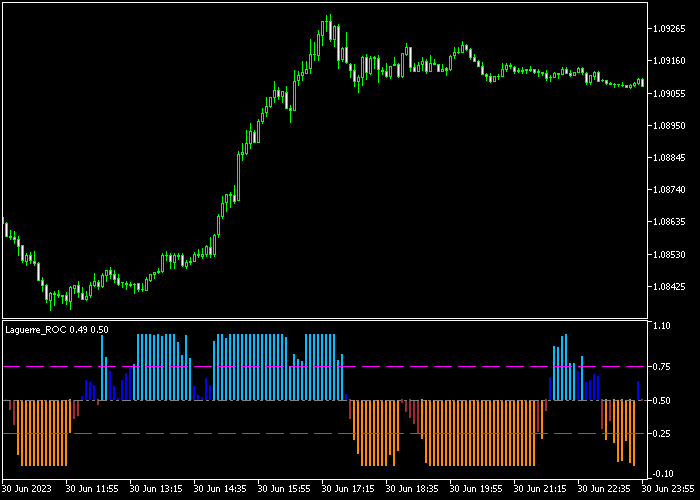
The chart shows the Laguerre ROC indicator for MT5 displaying a series of blue and orange bars in a dedicated sub-window.
You can see how the bars transition above the zero line to signal bullish expansions and drop below to mark bearish declines.

Guide to Trade with Laguerre ROC indicator
Buy Rules
- Monitor the indicator sub-window until the histogram bars cross back above the 0 level.
- Ensure the bars are blue to confirm that the short-term momentum has turned bullish.
- Execute a buy market order immediately upon the close of the first positive bar.
- Maintain the long position for as long as the histogram remains above the zero threshold.
Sell Rules
- Initiate a sell market order when the histogram bars drop back below the 0 level.
- Verify that the bars have turned orange to signal a bearish shift in price velocity.
- Check that the crossover is confirmed on a closed candle to avoid false momentum spikes.
- Keep the short trade active while the orange bars continue to print in negative territory.
Stop Loss
- Position your protective stop loss a few pips behind the nearest minor support zone for buys.
- Place a defensive stop loss above the immediate minor resistance level for all sell orders.
- Optionally, utilize a volatility-based stop to ensure the trade has enough room to breathe during spikes.
Take Profit
- Exit the trade for a fixed pip profit target based on the average daily range of the pair.
- Close the position manually as soon as the histogram crosses back to the opposite side of 0.
- Consider securing half of the profits once the trade reaches a 1:1 risk to reward ratio.
Laguerre ROC Indicator Day Trading Strategy for MT5
This day trading strategy pairs momentum strength with price clarity using the Laguerre ROC Forex Indicator and the Renko V2 Indicator.
It is designed to help traders capture clean moves by combining momentum signals with a trend‑focused Renko chart filter.
The Laguerre ROC Forex Indicator measures the speed and direction of price momentum.
A blue histogram suggests that bullish momentum is building, while an orange histogram indicates that bearish momentum is increasing.
This helps identify favorable moments to enter a trade when pressure is shifting.
The Renko V2 Indicator converts price into clean bricks that remove noise and emphasize the main trend bias.
Green Renko candles reflect upward movement, while red Renko candles confirm downward movement.
Buy Entry Rules
- Confirm that Renko V2 is producing green bricks, showing a bullish trend structure.
- Wait for the Laguerre ROC histogram to turn blue, signaling rising bullish momentum.
- Enter a buy trade when both conditions align at the close of a Renko brick or corresponding price bar.
- Place the stop loss just below the recent Renko support level or recent swing low.
- Close the trade when the Laguerre ROC histogram turns orange or when Renko bricks flip to red.
Sell Entry Rules
- Confirm that Renko V2 is producing red bricks, showing a bearish trend structure.
- Wait for the Laguerre ROC histogram to turn orange, signaling increasing bearish momentum.
- Enter a sell trade when both conditions align at the close of a Renko brick or corresponding price bar.
- Place the stop loss above the recent Renko resistance level or recent swing high.
- Close the trade when the Laguerre ROC histogram turns blue or when Renko bricks flip to green.
Case Study 1: GBPUSD M15 Bullish Session
On GBPUSD during a London session, the Renko V2 chart began forming consecutive green bricks, indicating bullish structure.
Shortly after, the Laguerre ROC histogram turned blue, showing rising buying momentum.
A buy order was taken when both signals aligned and the Renko brick closed green.
The stop loss was positioned below the recent support level on the Renko chart.
Price continued upward with strong bullish pressure.
When the Laguerre ROC histogram shifted to orange while the Renko bricks weakened, the position was exited for +26 pips.
Case Study 2: USDJPY H1 Sideways to Break
On USDJPY during the New York session, price had been consolidating before red Renko bricks began forming, signaling bearish trend pressure.
The Laguerre ROC histogram soon turned orange, confirming increasing downward momentum.
A sell trade was opened at the close of the confirming Renko brick with the stop placed above recent Renko resistance.
Price slid lower as selling pressure intensified.
The short trade was exited when the Laguerre ROC histogram flipped to blue and the Renko bricks began turning green, indicating a shift in momentum and marking the end of the bearish burst.
Download Now
laguerre_roc.mq5 Indicator (MT5)
FAQ
What is the benefit of combining Laguerre with ROC?
The ROC is excellent at measuring speed but can be very erratic.
Laguerre logic smooths out the price data without adding the significant lag found in standard moving averages, resulting in cleaner and more timely signals.
How do the overbought and oversold levels help?
These levels identify extreme momentum readings.
When the histogram reaches these thresholds, it suggests the current trend may be overextended, prompting traders to lock in profits or wait for a reversal.
Summary
The Laguerre ROC indicator offers a mathematically superior way to track momentum by reducing the noise that often plagues standard oscillators.
The blue and orange histograms make it easy for traders to stay disciplined and aligned with the current market flow.
Overall, it is a robust and responsive utility that provides a consistent framework for capturing short-term price expansions.
Testing different averaging ratios on a demo account is recommended to match the specific volatility of your preferred pairs.


