About the Figurelli Series Indicator
The Figurelli Series indicator for MT5 is a trend-following oscillator that identifies market momentum using a multi-layered moving average system.
Displayed as orange bars in a sub-window, it measures the transition between bullish and bearish phases based on the zero line.
It is designed to filter market noise, helping scalpers and intraday traders stay aligned with the dominant price direction across various currency pairs.
Free Download
figurelliseries.mq5 Indicator (MT5)
Key Features
- Calculates momentum through a specialized series of moving average steps.
- Uses orange trend bars to provide a clear visual of current market bias.
- Features a zero-line crossover system for objective buy and sell triggers.
- Allows customization of initial periods and smoothing types for different assets.
- Includes a horizontal shift parameter to better align signals with price action.
- Functions as a stable momentum filter for high-frequency trading environments.
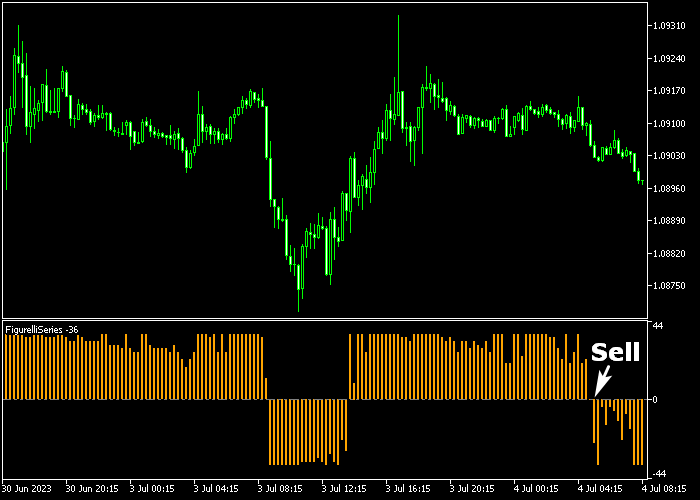
Indicator Chart
The chart shows the Figurelli Series indicator with orange bars oscillating around a central zero level.
You can see how the shifts above and below the line identify fresh momentum cycles.
These crossovers act as the primary signal for timing entries as the trend direction changes.

Guide to Trade with the Figurelli Series indicator
Buy Rules
- Enter a buy market order when an orange Figurelli Series trend bar appears above the 0 level.
- Confirm that the previous bar was below zero to ensure you are entering at a fresh reversal point.
- Verify that the price is showing bullish rejection at a key intraday level before execution.
- Hold the long position as long as the orange bars remain in positive territory above the zero line.
Sell Rules
- Initiate a sell market order as soon as a Figurelli Series trend bar prints below the 0 level.
- Check that the market has sufficient liquidity and volatility to sustain a downward move.
- Ensure the crossover is confirmed on a closed candle to avoid reacting to temporary price spikes.
- Maintain the short bias while the oscillator continues to display bars in the negative region.
Stop Loss
- Position your protective stop loss just below the nearest minor support level for buy trades.
- Place a defensive stop loss above the immediate minor resistance zone for sell market orders.
- Optionally, anchor your stop loss below the most recent consolidation floor to give the trade room to breathe.
Take Profit
- Exit the trade manually once you have secured a profit of 10 to 25 pips on the chart.
- Close the position immediately if the trend bar crosses back to the opposite side of the zero level.
- Target the next major horizontal technical level to maximize the reward from a strong trend move.
- Consider trailing your profit if the height of the orange bars continues to increase in your favor.
Figurelli SMA Trend Trading Strategy for MT5
This strategy combines momentum signals with trend confirmation using the Figurelli Series Forex Indicator and the Simple Moving Average (SMA) Indicator.
It is designed to help traders capture trend-driven moves while avoiding entries against the dominant direction.
The Figurelli Series produces an orange histogram that oscillates around zero.
Values above zero suggest bullish momentum, while values below zero indicate bearish pressure.
This helps time entries when momentum aligns with a developing trend.
The SMA Indicator uses a colored line to define trend direction.
A blue SMA line signals an uptrend, while an orange SMA line confirms a downtrend.
This setup works well on M15 and H1 charts, making it suitable for swing and intraday traders who want structured entries with trend alignment.
Buy Entry Rules
- Check that the SMA line is blue, indicating a bullish trend.
- Wait for the Figurelli histogram to cross above zero.
- Enter a buy trade at the close of the signal candle.
- Place the stop loss below the recent swing low.
- Close the trade when the histogram crosses back below zero or when the SMA line turns orange.
- Alternatively, target a 1:2 risk-to-reward level or exit near a prior structure high.
Sell Entry Rules
- Check that the SMA line is orange, indicating a bearish trend.
- Wait for the Figurelli histogram to cross below zero.
- Enter a sell trade at the close of the signal candle.
- Place the stop loss above the recent swing high.
- Close the trade when the histogram crosses back above zero or when the SMA line turns blue.
- You can also use a fixed pip target such as 20 pips for quick moves.
Case Study 1: USDCHF H1 Buy Trade
On the USDCHF H1 timeframe, the SMA line was blue, confirming an uptrend.
After a minor pullback, the Figurelli histogram crossed above zero, signaling renewed bullish momentum.
A buy trade was entered at the close of the signal candle. The stop loss was placed just below the recent swing low.
Price climbed steadily in line with the trend.
When the histogram dipped back below zero and the SMA began to flatten, that was the appropriate point to take profit and exit the position.
Case Study 2: AUDUSD M15 Sell Trade
On AUDUSD M15 during an active session, the SMA line had turned orange, reflecting bearish conditions.
The Figurelli histogram then crossed below zero, indicating increasing selling momentum.
A sell trade was opened at candle close with the stop loss set above the recent swing high.
Price descended with a clear series of lower lows.
When the histogram crossed back above zero, that signaled that the momentum was fading and the trade was concluded, capturing the core move.
Download Now
figurelliseries.mq5 Indicator (MT5)
FAQ
What do the period calculation step and initial period settings do?
The initial period sets the base speed, while the calculation step determines how averages are layered.
These settings allow you to fine-tune the indicator for fast scalping or smoother trend following.
Is this indicator effective on the M1 timeframe?
Yes, it is highly responsive on M1 and M5 charts.
It captures short-term momentum shifts quickly, which is essential for capturing pips during active London and New York sessions.
Why does the indicator use only one color for the bars?
The orange color represents the series itself.
The trend direction is determined by position rather than color; bars above zero are bullish, while bars below zero indicate bearish control.
Summary
The Figurelli Series indicator uses a unique averaging method to deliver a clean view of market momentum without the usual lag of basic oscillators.
By focusing on zero-line transitions, it helps traders maintain a disciplined approach to entering new trends.
Its versatility across different timeframes and assets makes it a valuable addition to any technical strategy.
Overall, it is a robust utility for improving timing and capturing intraday price movements effectively.


