
About the Flat Trend Indicator
The Flat Trend indicator for MT5 is a momentum tool designed to categorize market behavior into four distinct strength levels.
It uses a tiered threshold system to distinguish between a “flat” sideways market and an active trend.
By monitoring price smoothing and momentum velocity, the indicator highlights the transition from consolidation to weak, strong, and extremely strong directional moves.
This allows traders to filter out low-volatility periods and focus exclusively on high-probability trend expansions with sufficient market conviction.
Free Download
Key Features
- The indicator classifies market states into three strength levels and one sideways phase.
- Level 20 marks the transition from a flat market to the start of a trend.
- Level 40 indicates a strong trending environment suitable for trade entries.
- Level 60 identifies an extremely powerful trend with maximum momentum.
- Customizable smoothing and price types allow for tailored sensitivity and frequency.
- Visual colored dots provide immediate feedback on current market intensity in a sub-window.
Indicator Chart
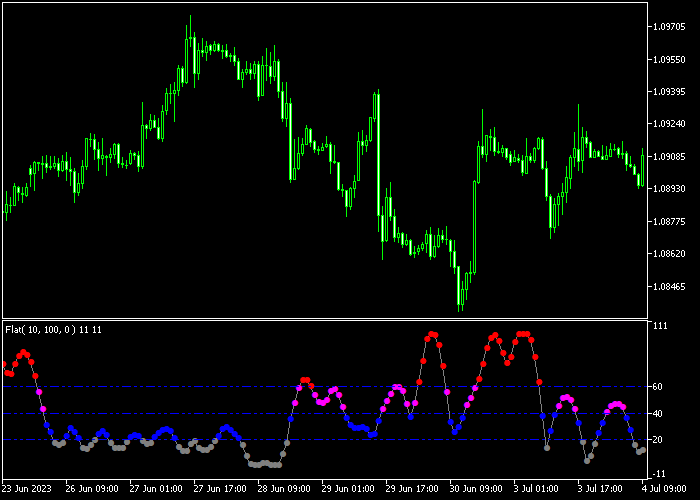
The chart shows the Flat Trend indicator displaying a series of dots at various heights.
You can see the dots fluctuating between the 20, 40, and 60 levels, providing a roadmap of trend development.
This visualization helps traders identify when the market leaves a sideways phase and enters a tradable trend.
Guide to Trade with Flat Trend Indicator
Buy Rules
- Enter a buy trade when the indicator dots rise above the 20 threshold during a bullish move.
- Confirm that the dots are climbing toward the 40 level to ensure the trend is gaining strength.
- Wait for a candle close above a local resistance level to validate the entry.
- Maintain the long position as long as the dots stay above the 20 level.
Sell Rules
- Initiate a sell market order when the indicator dots appear above the 20 level with a bearish bias.
- Verify that the momentum is significant enough to push the dots toward the 40 or 60 thresholds.
- Check that the dots have cleared the 20 mark to confirm the sideways market has ended.
- Keep the short trade active until the dots drop back into the “flat” zone below 20.
Stop Loss
- Set a fixed stop loss based on the Average True Range (ATR) to account for current market volatility.
- Use a dynamic exit by closing the trade if the indicator dots fall back into the sideways zone below 20.
- Utilize a trailing stop that follows the slope of a 50-period moving average to lock in gains.
Take Profit
- Exit the trade once the indicator dots begin to decline back toward the 20 level.
- Target a fixed profit based on recent market volatility when the 60 level is reached.
- Close the position if the market enters a “flat” state by dropping below the 20 mark.
- Consider scaling out of the trade as the dots reach higher threshold milestones.
Flat Trend Forex Scalping Strategy for MT5
This scalping strategy uses momentum thresholds and trend alignment to capture quick intraday moves on M5 and M15 charts with the Flat Trend Indicator and the Linear Weighted Moving Average (LWMA) Indicator.
It targets trades where momentum is clearly gaining strength in the direction of the trend.
The Flat Trend Indicator shows dots that measure momentum strength.
The LWMA Indicator filters trades by trend direction.
A blue line signals bullish bias, while an orange line reflects bearish conditions.
Combining the two ensures entries are taken only when both momentum and trend align.
Buy Entry Rules
- Wait for the Flat Trend dots to rise above 20 during a bullish move and show momentum toward 40.
- Confirm that the LWMA line is blue.
- Enter a buy trade at the close of the confirmation candle.
- Place the stop loss below the recent swing low.
- Close the trade when the dots start declining or the LWMA line changes to orange.
Sell Entry Rules
- Wait for the Flat Trend dots to appear above 20 during a bearish move and move toward 40 or 60.
- Confirm that the LWMA line is orange.
- Enter a sell trade at the close of the signal candle.
- Place the stop loss above the recent swing high.
- Close the trade when the dots start falling or the LWMA line shifts to blue.
Case Study 1: EURUSD M5 Buy Setup
During the London session on EURUSD M5, the Flat Trend dots climbed above 20 and continued toward 40, indicating building bullish momentum.
The LWMA line was blue, confirming the uptrend.
A buy trade was taken at candle close, with the stop placed below the most recent low.
Price pushed upward with several strong bullish candles.
When the dots leveled off and the LWMA line started to flatten, it was the point to exit the trade for a 21 pip profit.
Case Study 2: GBPJPY M15 Sell Setup
On GBPJPY M15 during the New York session, the Flat Trend dots appeared above 20 with momentum moving toward 40 in a bearish environment.
The LWMA line was orange, confirming downward trend strength.
A sell trade was entered at the close of the confirmation candle.
Price dropped in a series of steady red candles.
Once the Flat Trend dots began to decline and the LWMA showed signs of flattening, the trade was exited, capturing the core of the move efficiently.
Download Now
FAQ
What happens when the indicator is below the 20 level?
Below 20, the market is considered “flat” or sideways.
During this time, there is usually not enough momentum for trend-following trades, and it is often best to stay on the sidelines to avoid choppy price action.
Can I change the threshold levels?
Yes, the threshold levels (20, 40, 60) can be adjusted in the settings to better fit the volatility of specific assets like Gold or Indices, which might require higher thresholds to confirm a trend.
Is the smoothing period important?
The smoothing period determines how quickly the dots react to price changes.
A shorter period provides faster signals but may include more noise, while a longer period offers more stable trend confirmation.
Summary
The Flat Trend indicator provides a unique tiered system that identifies the specific intensity of market moves.
By clearly marking the difference between a sideways market and a tradable trend, it assists in filtering out low-probability setups.
The visual simplicity of the thresholds makes it easy to integrate into any existing trading plan.
Overall, it is a robust tool for improving trend selection and risk management.
Testing the smoothing settings on a demo account is recommended to match your specific trading frequency.


