
About the Speedometer Indicator
The Speedometer indicator for MT5 is a specialized momentum tool that measures the rate of market activity rather than just price change.
It functions by calculating the speed of incoming price ticks, the total distance the price has traveled, and the specific time elapsed in milliseconds.
By monitoring the velocity of price movement, you can distinguish between slow, corrective grinds and aggressive, impulsive breakouts.
When the “speed” of the market increases, it often precedes a significant directional move.
This tool is essential for traders who rely on volatility to fuel their strategies, as it confirms whether a move has the necessary participation to sustain its momentum.
Free Download
speedometer.mq5 Indicator (MT5)
Key Features
- Measures tick velocity in real-time to gauge market aggression.
- Displays the exact distance price moves over a specific time interval.
- Calculates execution and movement speeds down to the millisecond.
- Provides customizable alerts when market speed exceeds a set threshold.
- Features a flexible interface with adjustable fonts, colors, and positions.
Indicator Chart
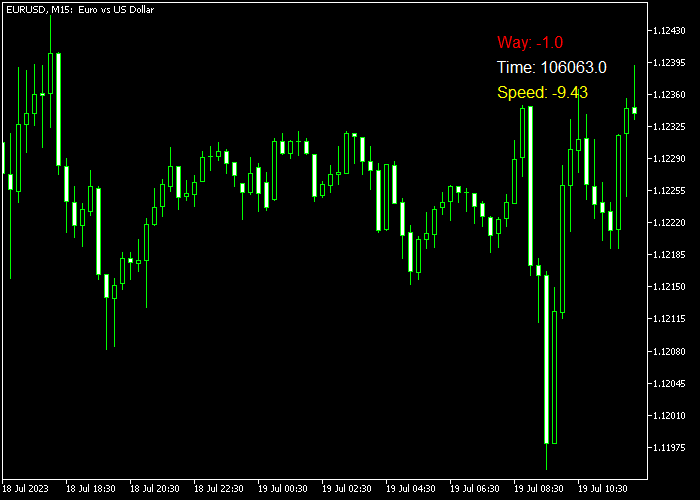
The Speedometer indicator chart displays a data panel in the corner of the terminal window.
It presents a live feed of tick speed and distance, which fluctuates rapidly during high-volatility events like news releases or session opens.
Guide to Trade with the Speedometer Indicator
Buy Rules
- Watch for a sudden spike in tick speed that coincides with a bullish breakout.
- Confirm that the distance covered by the price is increasing significantly.
- Enter a buy trade when high-speed activity aligns with a move above resistance.
- Verify that the speed stays above the threshold to support the upward move.
Sell Rules
- Identify a rapid increase in tick velocity during a bearish price move.
- Wait for the indicator to show a high distance-to-time ratio on the downside.
- Initiate a sell transaction as market intensity peaks at a support break.
- Monitor the speed to ensure that selling pressure is not fading prematurely.
Stop Loss
- Place the stop loss beyond the low of the candle that initiated the speed spike.
- Position the exit level outside of the current high-volatility range.
- Adjust the stop loss wider if the speedometer shows extreme market turbulence.
Take Profits
- Close the position when the tick speed begins to drop back to normal levels.
- Target a profit zone based on the average distance the price travels during spikes.
- Exit the trade if the price stalls while the speedometer remains at a high value.
- Use fixed targets that represent a multiple of the initial volatility-based risk.
Speedometer Indicator Scalping Strategy for MT5
This scalping strategy combines the Speedometer indicator for MT5 with the Trend Hunter Forex indicator for MT5 to create a fast and precise trading approach for lower timeframes.
The method focuses on capturing short bursts of momentum using the Speedometer while confirming direction with Trend Hunter signals.
It works especially well on M1 and M5 charts where quick price movements and volatility create frequent opportunities.
The Speedometer indicator measures the speed of price movement by tracking tick activity, distance traveled, and time in milliseconds.
The Trend Hunter indicator complements this by providing clear directional signals through arrows, making entry decisions simple and structured.
This strategy fits traders who prefer quick trades and high-probability setups based on momentum confirmation.
Buy Entry Rules
- Wait for a blue arrow from the Trend Hunter indicator to appear.
- Confirm that the Speedometer indicator shows increasing speed or strong momentum.
- Enter a buy trade at the opening of the next candle.
- Place the stop loss below the most recent minor support level or recent swing low.
- Take profit when the Speedometer begins to slow down significantly or when an opposite Trend Hunter signal appears.
Sell Entry Rules
- Wait for a magenta arrow from the Trend Hunter indicator to appear.
- Confirm that the Speedometer indicator shows strong downward momentum or increasing speed.
- Enter a sell trade at the opening of the next candle.
- Place the stop loss above the nearest resistance level or recent swing high.
- Take profit when momentum weakens on the Speedometer or when an opposite Trend Hunter signal appears.
Case Study 1: Buy Trade on M1 (EUR/USD)
A blue arrow appeared on the M1 timeframe on EUR/USD, signaling a potential buy opportunity.
At the same time, the Speedometer indicator showed a noticeable increase in market speed, indicating strong participation and momentum.
The trade was entered at the next candle open. Price moved quickly upward as momentum continued to build.
The Speedometer remained elevated during the move, confirming strength.
As soon as the indicator began to slow down, the position was closed.
The trade was closed in profit after capturing a sharp upward move.
Case Study 2: Sell Trade on M5 (GBP/JPY)
On the M5 timeframe on GBP/JPY, a magenta arrow appeared, indicating a sell signal.
The Speedometer confirmed this setup by showing a surge in downward momentum, suggesting that sellers were in control.
A sell position was opened at the next candle. Price dropped steadily with strong momentum.
The Speedometer remained active during the move, supporting the continuation.
When the momentum started to decrease, the trade was closed.
The trade was closed with a solid gain as the downward move lost strength.
Download Now
speedometer.mq5 Indicator (MT5)
FAQ
How does the threshold value help in filtering trades?
The threshold value allows you to set a baseline for what you consider “fast” market movement.
By adjusting this in the settings, the indicator will only alert you when the market exceeds this specific speed, helping you ignore the slow, choppy price action that often leads to false breakouts.
Can the speedometer predict a reversal?
While it is primarily a momentum tool, it can signal exhaustion.
If price reaches a key level and the speedometer shows an extreme spike followed by a rapid collapse in speed, it often indicates that the current move has run out of participants and a reversal may be imminent.
Why does the indicator show time in milliseconds?
The forex market moves incredibly fast, especially during high-frequency trading sessions.
Measuring in milliseconds allows the indicator to capture the most granular data possible, providing a more accurate representation of tick-by-tick momentum than standard time-based charts.
Summary
The Speedometer indicator is a unique utility that offers a deep look into the engine of market movement.
By focusing on tick speed, distance, and time, it provides a layer of data that traditional technical indicators simply cannot reach.
Its ability to send alerts whenever the speed exceeds a threshold makes it an invaluable companion for traders who need to react quickly to volatility.


