
About the Slope Direction Line Indicator
The Slope Direction Line indicator for MT5 is a momentum-based trend filter that simplifies market analysis by tracking the angle of price movement.
It functions as an adaptive moving average that changes color based on its current trajectory.
When the line slopes upward, it indicates bullish control; when it angles downward, it signals bearish dominance.
Traders use this tool to eliminate the ambiguity of traditional moving averages, which often lack clear visual triggers for entry.
By focusing on the slope’s direction, the indicator helps you stay aligned with the primary market force and avoid trading against strong momentum.
It is highly effective for identifying trend reversals in their early stages and can be customized with various smoothing methods to match the volatility of different currency pairs.
Free Download
slopedirectionline.mq5 Indicator (MT5)
Key Features
- Calculates trend direction through a specialized moving average slope.
- Features a blue and red color-coding system for instant signal recognition.
- Includes adjustable period and smoothing methods to refine signal accuracy.
- Supports real-time alerts including sound, mail, and terminal notifications.
- Works efficiently across all timeframes, especially for M1 and M5 scalping.
Indicator Chart
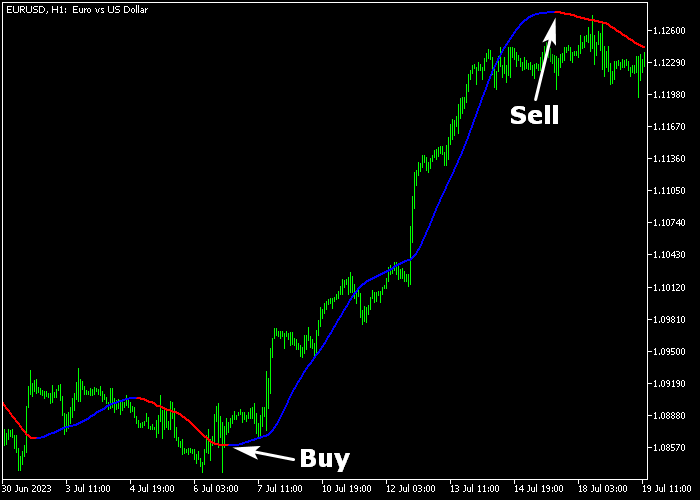
The Slope Direction Line indicator chart displays a single line that overlays the price action.
A blue line signifies an active uptrend, suggesting that the path of least resistance is to the upside.
Conversely, a red line indicates a downtrend, signaling that sellers are in control.
The transition between these colors marks the specific moment a trade signal is generated.
Guide to Trade with Slope Direction Line indicator
Buy Rules
- Monitor the signal line until it transitions from red to blue.
- Initiate a buy trade immediately once the blue slope direction line appears.
- Keep the position open as long as the line remains blue.
Sell Rules
- Wait for the blue slope direction line to change color to red.
- Execute a sell order at the opening of the next candle after the color shift.
- Follow the bearish momentum until the indicator suggests a trend change.
Stop Loss
- For buy trades, position a stop loss order below the most recent support level.
- For sell trades, place the stop loss order above the most recent resistance region.
Take Profit
- Close the buy trade as soon as the red colored signal line appears on the chart.
- Exit the sell trade when the blue colored signal line is displayed.
- Secure potential gains at established psychological levels or major round numbers.
MT5 Slope Direction Line Indicator Day Trading Strategy
This day trading strategy combines the Slope Direction Line indicator for MT5 with the Clever Forex Scalper indicator for MT5 to create a structured approach for intraday trading.
The strategy focuses on trading with the main trend while using precise entry signals to time entries.
The Slope Direction Line identifies the overall market direction through color changes, while the Clever Forex Scalper provides clear arrow signals for entries.
The Slope Direction Line works by analyzing the slope of a moving average and changing color based on trend direction.
A blue line signals bullish conditions, while a red line signals bearish pressure.
This combination works well on M15, M30, and H1 timeframes and is ideal for traders who want consistent intraday setups without overcomplicating their analysis.
By trading only in the direction of the Slope Direction Line and using arrow confirmations, traders can improve timing and avoid low-quality setups during ranging conditions.
Buy Entry Rules
- Wait for the Slope Direction Line to turn blue, confirming an uptrend.
- Look for a blue arrow from the Clever Forex Scalper indicator.
- Enter a buy trade at the opening of the next candle.
- Place the stop loss below the most recent support level.
- Take profit when the Slope Direction Line turns red or when an opposite arrow appears.
Sell Entry Rules
- Wait for the Slope Direction Line to turn red, confirming a downtrend.
- Look for a red arrow from the Clever Forex Scalper indicator.
- Enter a sell trade at the opening of the next candle.
- Place the stop loss above the nearest resistance level.
- Take profit when the Slope Direction Line turns blue or when an opposite arrow appears.
Case Study 1: Buy Trade on M15 (AUD/USD)
On the M15 timeframe on AUD/USD, the Slope Direction Line shifted to blue, indicating a developing bullish trend.
Shortly after, a blue arrow appeared from the Clever Forex Scalper, confirming a valid entry.
A buy trade was opened at the next candle. Price continued to move upward steadily as the trend remained intact.
The blue line stayed consistent, showing trend strength.
The position was held until the Slope Direction Line changed color, signaling weakening momentum.
The trade was closed in profit after capturing a clean intraday move.
Case Study 2: Sell Trade on H1 (USD/CAD)
On the H1 timeframe on USD/CAD, the Slope Direction Line turned red, indicating bearish market conditions.
A red arrow from the Clever Forex Scalper appeared shortly after, aligning perfectly with the trend direction.
A sell position was opened at the next candle open. Price declined gradually with a strong bearish structure.
The red line remained stable throughout the move, confirming trend continuation.
When the indicator shifted back to blue, the trade was closed. The trade was closed with a solid gain as the downward trend slowed.
Download Now
slopedirectionline.mq5 Indicator (MT5)
FAQ
What is the best way to use this indicator for scalping?
For scalping on M1 or M5 charts, focus on high-liquidity sessions like the London and New York crossover.
Use the indicator on pairs with tight spreads to ensure that transaction costs do not eat into your small price targets.
Can I change the moving average method used for the slope?
Yes, the indicator allows you to adjust the “method” parameter.
You can choose between Simple, Exponential, Smoothed, or Linear Weighted averages.
Each method will change how quickly the line reacts to price spikes and shifts in direction.
How do the alerts function in the Slope Direction Line indicator?
The indicator features built-in alert systems for sound, email, and push notifications.
Summary
The Slope Direction Line indicator generates trading signals based on the upward or downward slope of a moving average.
It provides buy and sell trade opportunities through a signal line displayed in two distinct colors, making it one of the most accessible tools for trend followers.
While it is a versatile standalone tool, its performance is significantly enhanced when applied to currency pairs with narrow spreads during peak trading hours.
By following the simple logic of buying on blue and selling on red, traders can maintain a consistent approach to the markets.


