
About the Buy Sell Forex Dashboard Indicator
The Buy Sell Forex Dashboard indicator for MT5 is designed to provide a quick overview of market conditions by combining several technical indicators into one simple dashboard.
It analyzes market data using a group of technical indicators including multiple simple moving averages, the RSI indicator, and the Stochastic Oscillator.
Each indicator contributes to the overall market signal displayed by the dashboard.
The system evaluates moving averages such as the 5, 10, 20, 50, 100, and 200 periods to determine trend direction across different time horizons.
At the same time, the RSI and Stochastic indicators help measure momentum and potential overbought or oversold conditions.
Based on the combined readings, the dashboard generates buy or sell signals.
Free Download
Key Features
- Displays a compact dashboard in the upper right corner of the trading platform.
- Combines multiple technical indicators into one signal system.
- Uses six simple moving averages to evaluate market trend strength.
- Includes RSI and Stochastic Oscillator for momentum analysis.
- Generates buy or sell signals based on aggregated indicator data.
Indicator Chart
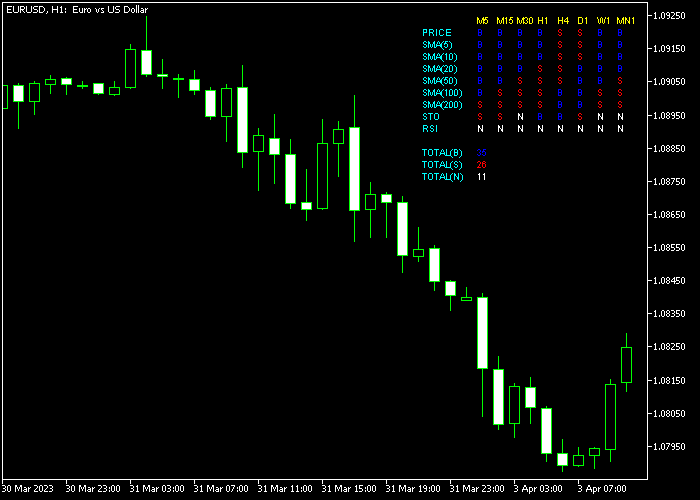
The Buy Sell Forex Dashboard indicator displays a signal panel in the upper right corner of the trading window.
The dashboard evaluates multiple indicators and shows whether the market conditions favor a buy or sell direction across the selected timeframe.
Guide to Trade with Buy Sell Forex Dashboard Indicator
Buy Rules
- Monitor the dashboard and wait until at least 80 percent of the indicators display a buy signal marked as “B”.
- This condition suggests strong bullish momentum based on the combined technical indicators.
- Open a buy trade once the dashboard confirms the bullish majority signal.
Sell Rules
- Watch the dashboard until at least 80 percent of the indicators switch to a sell signal marked as “S”.
- This signal indicates strong bearish pressure according to the technical readings.
- Open a sell trade once the majority of indicators confirm the bearish direction.
Stop Loss
- Place the stop loss below the most recent support area when opening buy trades.
- Place the stop loss above the most recent resistance level when opening sell trades.
- Consistent risk management protects the account from large losses.
Take Profit
- Close the buy trade when the dashboard shifts to a sell signal.
- Close the sell trade when the dashboard switches to a buy signal.
- Traders may also use fixed reward targets based on their trading plan.
- Support and resistance levels can provide additional profit targets.
MT5 Buy Sell Forex Dashboard Indicator Day Trading Strategy
This strategy combines the Buy Sell Forex Dashboard Indicator with the Volty Channel Stop Indicator to create a clear and rule-based day trading method.
The Buy Sell Forex Dashboard provides direct entry signals using “B” for buy and “S” for sell.
The Volty Channel Stop confirms the market direction using a dynamic trend line.
This indicator is based on volatility and trend behavior, helping traders identify direction and reversals more clearly.
By combining signal and trend confirmation, this setup filters out weak entries and keeps trades aligned with the current intraday direction.
It works best on M5 and M15 timeframes during active sessions.
Buy Entry Rules
- Wait for a “B” signal from the Buy Sell Forex Dashboard indicator.
- Confirm that the Volty Channel Stop line is blue.
- Enter a buy trade at the close of the signal candle.
- Place the stop loss below the recent swing low or below the blue Volty line.
- Close the buy trade when an “S” signal appears from the Buy Sell Forex Dashboard indicator or when the Volty Channel Stop line turns red.
- An optional exit can be set at a nearby resistance level.
Sell Entry Rules
- Wait for an “S” signal from the Buy Sell Forex Dashboard indicator.
- Confirm that the Volty Channel Stop line is red.
- Enter a sell trade at the close of the signal candle.
- Place the stop loss above the recent swing high or above the red Volty line.
- Close the sell trade when a “B” signal appears from the Buy Sell Forex Dashboard indicator or when the Volty Channel Stop line turns blue.
- Optional exit can target a nearby support level.
Case Study 1: EURUSD M5 Day Trade
On the EURUSD M5 timeframe, the Buy Sell Forex Dashboard indicator printed a “B” signal during an upward move.
The Volty Channel Stop line was blue, confirming bullish direction.
A buy trade was entered after the signal candle closed. The stop loss was placed below the recent swing low.
Around 45 minutes later, an “S” signal appeared from the Buy Sell Forex Dashboard indicator.
The buy trade was closed at that point, following the dashboard’s opposite signal.
Case Study 2: USDJPY M15 Intraday Trade
On the USDJPY M15 timeframe, the Buy Sell Forex Dashboard indicator printed an “S” signal after price rejected a higher level.
The Volty Channel Stop line stayed red, confirming bearish direction.
A sell trade was entered after confirmation. The stop loss was placed above the recent swing high.
About 30 minutes later, the Volty Channel Stop line changed from red to blue.
The sell trade was closed once the Volty Channel Stop indicator signaled a reversal in direction.
Download Now
FAQ
How does the dashboard calculate its signals?
The dashboard evaluates signals from several technical indicators including multiple simple moving averages, the RSI indicator, and the Stochastic Oscillator.
It then summarizes the data and displays the dominant market direction.
What does the 80 percent rule mean?
The 80 percent rule means that most indicators in the dashboard agree on the same direction.
When at least 80 percent of the indicators show buy or sell signals, the system considers the market direction strong.
Summary
The Buy Sell Forex Dashboard indicator provides a practical way to monitor several technical indicators from one location on the trading platform.
By combining moving averages with momentum indicators, the dashboard summarizes overall market sentiment into simple buy or sell signals.
This tool can save time during analysis because traders no longer need to manually check each indicator.
The dashboard quickly highlights whether the market currently favors bullish or bearish conditions.


