
About the CCI Divergence Indicator
The CCI Divergence Indicator for MT5 is a specialized tool that identifies divergences between price action and the Commodity Channel Index (CCI).
Divergences occur when price moves in one direction while the CCI oscillator moves in the opposite direction, often signaling an upcoming trend reversal.
Bullish divergences appear when price forms lower lows while the CCI forms higher lows, and the indicator marks these with a blue arrow.
Bearish divergences occur when price creates higher highs while the CCI forms lower highs, marked with a red arrow.
These signals allow traders to anticipate potential reversals before price fully shifts.
This indicator can be used as a standalone tool for trade entries.
Traders can combine it with support, resistance, or trend analysis to enhance signal accuracy.
Free Download
Key Features
- Detects bullish and bearish divergences between price and CCI.
- Displays clear blue and red arrows for buy and sell signals.
- Can be used as a standalone tool for trade entries.
- Helps anticipate trend reversals before they occur.
- Lightweight and efficient for MT5 without slowing the platform.
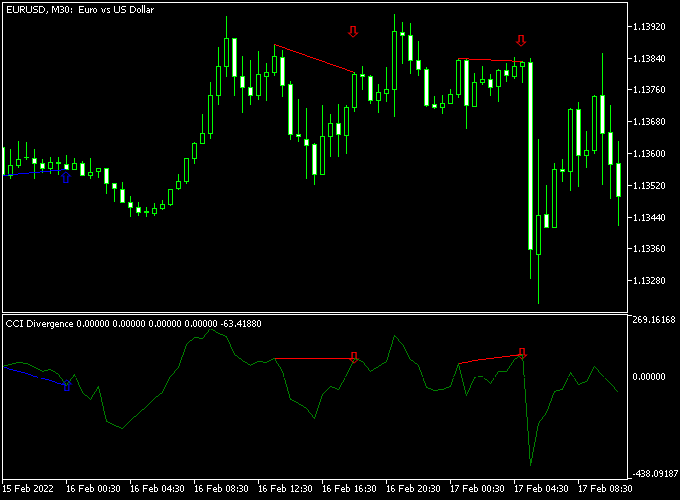
Indicator Chart
The CCI Divergence Indicator displays arrows on the main chart to mark divergence signals.
Blue arrows highlight bullish divergences for potential buy trades, while red arrows indicate bearish divergences for potential sell trades.
The chart demonstrates how divergences can precede trend reversals.
Guide to Trade with CCI Divergence Indicator
Buy Rules
- Wait for a blue arrow to appear on the chart indicating bullish divergence.
- Confirm that momentum is starting to shift upward.
- Check that the signal aligns with nearby support levels or trend direction.
- Open a buy trade once the divergence is validated.
Sell Rules
- Wait for a red arrow to appear on the chart indicating bearish divergence.
- Confirm that momentum is starting to shift downward.
- Check for alignment with resistance levels or trend reversal zones.
- Open a sell trade once the divergence is validated.
Stop Loss
- Set the stop loss just beyond the price extreme that caused the divergence (recent high for sell, recent low for buy).
- Use a buffer of a few pips beyond the divergence point to avoid being stopped out by minor fluctuations.
- Consider adjusting the stop dynamically as the trade moves in your favor.
Take Profit
- Close buy trades near the next resistance level or previous swing high.
- Close sell trades near the next support level or previous swing low.
- Exit early if an opposite divergence signal appears.
- Optionally, use partial profit taking to lock in gains while letting trends run.
CCI Divergence MT5 Forex Strategy for H1 Charts
This divergence trading strategy combines the CCI Divergence indicator with the Trading the Trend Histogram indicator to capture reversal and continuation opportunities based on momentum shifts and trend confirmation.
The CCI Divergence indicator highlights turning points using blue arrows for bullish divergence and red arrows for bearish divergence.
The Trend Histogram indicator confirms direction through consecutive blue bars for bullish conditions and brown bars for bearish conditions.
This strategy is designed for H1 charts where price tends to develop clearer swings and divergence signals carry more reliability.
The histogram acts as a trend filter, while the divergence indicator identifies weakening momentum at potential reversal zones.
Trades are only considered when both tools provide aligned confirmation or early transition signals.
The main concept is to trade divergence only when it appears within clear directional market behavior supported by histogram confirmation, avoiding setups that go against strong ongoing momentum.
Buy Entry Rules
- CCI Divergence indicator prints a blue arrow indicating bullish divergence (price forms a lower low while momentum strengthens).
- Trading the Trend Histogram shows consecutive blue bars or shifts from brown to blue, confirming bullish direction.
- Enter a buy trade after a bullish rejection candle closes from the divergence zone.
- Stop loss is placed below the most recent swing low formed during the divergence formation.
- Take profit is executed when the Trend Histogram changes from blue to brown, indicating weakening bullish momentum and triggering a full exit of the buy position.
Sell Entry Rules
- CCI Divergence indicator prints a red arrow indicating bearish divergence (price forms a higher high while momentum weakens).
- Trading the Trend Histogram shows consecutive brown bars or shifts from blue to brown, confirming bearish direction.
- Enter a sell trade after a bearish rejection candle closes from the divergence zone.
- Stop loss is placed above the most recent swing high formed during the divergence formation.
- Take profit is executed when the Trend Histogram changes from brown to blue, indicating weakening bearish momentum and triggering a full exit of the sell position.
Case Study 1 Buy Scenario (GBPUSD H1)
GBPUSD was moving lower before price formed a new swing low while the CCI Divergence indicator printed a blue bullish divergence arrow.
Two candles later, the Trading the Trend Histogram began shifting from brown to blue, indicating early bullish momentum development.
A buy trade was entered after a strong rejection candle confirmed support at the divergence area.
8 hours later, the trade was closed when the Histogram switched back to brown, showing that bullish momentum had faded and triggering the exit rule for the buy trade.
Case Study 2 Sell Scenario (EURJPY H1)
EURJPY was trending upward before price created a higher high while the CCI Divergence indicator printed a red bearish divergence arrow.
The Trading the Trend Histogram initially remained blue but later transitioned into brown bars, confirming loss of bullish strength.
A sell trade was entered after a rejection candle formed at the divergence level.
One day later, the short trade was closed when the Histogram returned to blue, signaling a shift in momentum and activating the exit condition for the sell position.
Download Now
FAQ
What is a divergence in the CCI Divergence Indicator?
A divergence occurs when price and the CCI oscillator move in opposite directions.
This can signal that the current trend is weakening and a reversal may occur.
Are the arrow signals reliable for trade entry?
Yes, the arrows are generated based on divergence patterns and can be used as standalone entry signals, though confirmation with price action or support/resistance may improve accuracy.
Summary
The CCI Divergence Indicator is a powerful tool for spotting trend reversals by highlighting divergences between price and the CCI oscillator.
Its blue and red arrows provide clear, actionable signals that simplify decision-making for traders.
By combining divergence signals with proper stop loss and take profit placement, traders can improve trade timing and manage risk effectively.
Its simplicity, visual clarity, and adaptability make the CCI Divergence Indicator a reliable addition to any trader’s strategy for anticipating market reversals.


