
About the Commitment of Traders Indicator
The Commitment of Traders COT Indicator for MT5 displays futures market positioning data directly on your chart.
It reflects how different groups of traders are positioned at the end of each reporting session, typically based on Tuesday’s data release.
The indicator visualizes the Commitment of Traders Report, Traders in Financial Futures data, and Open Interest values within a single window.
This allows you to monitor institutional sentiment, speculative exposure, and overall market participation.
Because COT data reflects broader positioning rather than short-term fluctuations, it performs best on higher timeframes such as H4, Daily, and Weekly charts.
It helps traders understand long-term market bias rather than intraday momentum.
The indicator supports major currency pairs and also includes USDMXN, offering wider coverage for macro-focused traders.
Free Download
Key Features
- Displays Commitment of Traders positioning data.
- Includes Traders in Financial Futures statistics.
- Shows Open Interest levels.
- Combines multiple datasets in one window.
- Optimized for higher timeframe analysis.
- Supports major currency pairs and USDMXN.
- Helps identify long-term sentiment shifts.
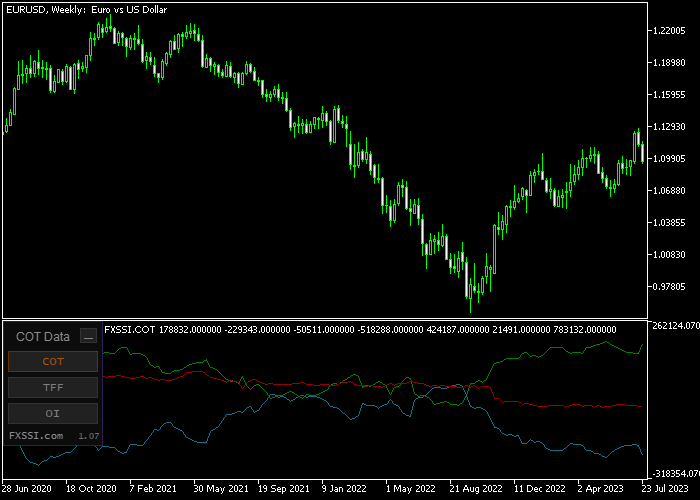
Indicator Chart
The COT Indicator displays net positioning of different trader groups along with open interest data in a dedicated window below the main price area.
Rising net long positions often signal increasing bullish sentiment, while expanding net short exposure may indicate growing bearish pressure.
Open interest changes can confirm whether participation supports the prevailing trend.
Guide to Trade with Commitment of Traders COT Indicator
Buy Guidance
- Identify increasing net long positions from large speculators.
- Confirm rising open interest supporting bullish exposure.
- Align the signal with a higher timeframe uptrend.
- Enter buy trades on pullbacks within the broader bullish bias.
Sell Guidance
- Identify increasing net short positions from large speculators.
- Confirm rising open interest supporting bearish exposure.
- Align the signal with a higher timeframe downtrend.
- Enter sell trades on retracements within the broader bearish bias.
COT T3 Moving Average Swing Strategy MT5
This swing trading strategy combines futures market positioning with momentum signals by using the Commitment of Traders COT Indicator for MT5 and the T3 Moving Average Alarm Indicator MT5.
It is designed for higher timeframes including H4, Daily, and Weekly charts, helping traders align with both long-term market trends and short-term momentum.
The COT Indicator provides insights into futures market positioning.
By observing whether large traders or commercial participants are net long or short, traders can gauge potential market direction and identify high-probability trade setups.
The T3 Moving Average Alarm Indicator generates entry signals with colored arrows.
A blue arrow signals a buy opportunity while a red arrow signals a sell opportunity.
Using this momentum trigger together with COT data helps traders enter trades that align with both market positioning and short-term price momentum.
This strategy works best on H4, Daily, and Weekly timeframes.
Buy Entry Rules
- Confirm that COT data shows bullish positioning, indicating that large traders are net long.
- Wait for a blue arrow from the T3 Moving Average Alarm Indicator.
- Enter a buy trade immediately after the arrow appears.
- Place a stop loss below the recent swing low or below the nearest support level.
- Close the trade fully when a red arrow appears or if COT positioning shifts toward net short.
Sell Entry Rules
- Confirm that COT data shows bearish positioning, indicating that large traders are net short.
- Wait for a red arrow from the T3 Moving Average Alarm Indicator.
- Enter a sell trade immediately after the arrow appears.
- Place the stop loss above the recent swing high or above the nearest resistance level.
- Close the trade completely when a blue arrow appears or if COT positioning shifts toward net long.
Case Study 1: EURUSD Buy Trade
On the Daily chart, COT data showed bullish positioning among commercial traders.
Shortly after, the T3 Moving Average Alarm Indicator displayed a blue arrow.
A buy trade was entered immediately after the signal. Price moved upward steadily over the next several sessions.
The trade was closed when a red arrow appeared, securing 120 pips.
Case Study 2: GBPJPY Sell Trade
On the H4 chart, COT data indicated that large traders were net short, reflecting bearish sentiment.
Shortly after, the T3 Moving Average Alarm Indicator showed a red arrow.
A sell trade was executed immediately after the signal. Price declined consistently following the trend.
The position was closed when a blue arrow appeared, capturing 95 pips.
Download Now
FAQ
Why does the COT indicator work better on higher timeframes?
COT data reflects institutional positioning rather than short-term price action.
It captures broader sentiment shifts that develop over days or weeks.
What does rising open interest indicate?
Rising open interest suggests increasing market participation.
When aligned with net positioning, it strengthens the reliability of the signal.
How often is the data updated?
COT data is typically based on Tuesday’s market positioning and released later in the week, reflecting institutional exposure at that time.
Summary
This trading tool provides insight into institutional positioning and broader market sentiment.
Combining COT, TFF, and open interest data in one place gives Forex traders a macro-level perspective that short-term indicators cannot provide.
It works best on higher timeframes where positioning trends unfold gradually.
Users who align technical analysis with institutional sentiment can identify stronger directional bias and improve long-term trade selection.


