
About the Directional Breakout Indicator
The Directional Breakout indicator for MT5 is a scalping tool designed to provide clear buy and sell signals based on short-term market trends.
It uses a colored histogram to visually represent market bias, allowing traders to quickly identify trading opportunities.
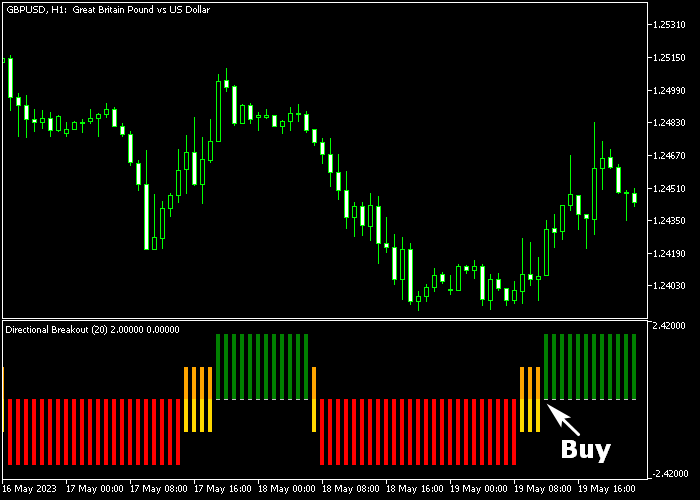
The indicator displays three colors: green bars indicate bullish conditions, red bars indicate bearish conditions, and yellow bars signal a neutral market where traders should stand aside.
This system makes it easy to focus only on high-probability setups.
The indicator also includes adjustable inputs such as moving average period, moving average method, and applied price.
These settings allow traders to fine-tune the indicator for different pairs and timeframes.
It is most effective on low-spread currency pairs, where tight spreads minimize costs and maximize scalping efficiency.
Free Download
Directional_Breakout.mq5 Indicator (MT5)
Key Features
- Colored histogram bars for bullish, bearish, and neutral market conditions.
- Designed specifically for short-term scalping strategies.
- Non-repainting bars to prevent false signal adjustments.
- Customizable moving average period, method, and applied price.
- Works best on low-spread currency pairs.
- Provides multiple high-probability entries during active sessions.
- Compatible with all timeframes suitable for scalping.
Indicator Chart
The Directional Breakout Indicator plots a colored histogram on the main price area, showing green, red, and yellow bars that indicate bullish, bearish, and neutral conditions.
Traders watch for the first appearance of green or red bars to determine potential buy or sell entries, while yellow bars signal periods of market indecision where trades are avoided.
Guide to Trade with Directional Breakout Indicator
Buy Rules
- Wait for the first green histogram bar to appear.
- This signals the start of a bullish trend.
- Open a buy trade after confirming the green bar.
- Focus on low-spread pairs for better scalping efficiency.
Sell Rules
- Wait for the first red histogram bar to appear.
- This indicates a bearish trend is beginning.
- Open a sell trade after confirming the red bar.
- Trade during active sessions for stronger momentum.
Stop Loss
- Place the stop loss just beyond the nearest support or resistance level.
- For buy trades, position the stop slightly below recent support.
- For sell trades, place the stop slightly above recent resistance.
- This placement allows the trade room to follow the trend while limiting potential loss.
Take Profit
- Close the trade after reaching 6-15 pips profit, depending on market volatility.
- Partial exits can be taken near minor support or resistance levels.
- Alternatively, exit trades when the histogram shows a color change or slowdown.
- Use your preferred target if it aligns with current market conditions.
Directional Breakout and Super Trend Hull Forex Strategy for MT5
This strategy combines the Directional Breakout Indicator with the Super Trend Hull Indicator to create a structured trend-following and breakout trading system.
The Directional Breakout Indicator uses a histogram to show market direction.
Green bars indicate bullish momentum and a possible buy signal, while red bars indicate bearish momentum and a sell signal.
The Super Trend Hull Indicator confirms the overall trend using a color-coded line.
Green represents an uptrend and violet represents a downtrend.
When both indicators align, the probability of a strong directional move increases.
This strategy works best on M5 and M15 charts during London and New York sessions where breakouts and trend continuation are more reliable.
Buy Entry Rules
- Wait for green histogram bars on the Directional Breakout Indicator, showing bullish momentum.
- Confirm that the Super Trend Hull line is green, indicating an uptrend.
- Enter a buy trade at the close of the confirmation candle.
- Place stop loss below the most recent swing low or below the Super Trend Hull line.
- Close the trade when the histogram turns red or when the Super Trend Hull line switches to violet.
Sell Entry Rules
- Wait for red histogram bars on the Directional Breakout Indicator, showing bearish momentum.
- Confirm that the Super Trend Hull line is violet, indicating a downtrend.
- Enter a sell trade at the close of the confirmation candle.
- Place stop loss above the most recent swing high or above the Super Trend Hull line.
- Close the trade when the histogram turns green or when the Super Trend Hull line switches to green.
Case Study 1: Trend Breakout Buy Setup
On EURUSD M15, the market was moving sideways before momentum increased.
The Directional Breakout Indicator printed consecutive green histogram bars, signaling bullish pressure building in the market.
At the same time, the Super Trend Hull line flipped from violet to green, confirming a new upward trend.
A buy trade was entered at the close of the signal candle.
Price began to move upward in structured waves, respecting minor pullbacks while staying above the Super Trend Hull line.
The trade was managed using the indicator as a dynamic guide.
The trade was closed when the Directional Breakout histogram turned red, showing weakening momentum and potential reversal.
Case Study 2: Bearish Continuation Sell Setup
On GBPJPY M5, price failed to break higher and started showing downward pressure.
The Directional Breakout Indicator printed red histogram bars, confirming bearish momentum.
The Super Trend Hull line was already violet, showing that the broader trend was bearish.
A sell trade was entered at the close of the confirmation candle.
Price continued downward with small retracements but remained below the Super Trend Hull line, confirming trend strength.
The trade was closed when the Super Trend Hull line switched back to green, indicating a possible trend reversal.
Download Now
Directional_Breakout.mq5 Indicator (MT5)
FAQ
Which currency pairs work best with this indicator?
Low-spread pairs are recommended for scalping. Tight spreads reduce costs and improve the effectiveness of short-term trades.
Can the indicator settings be adjusted?
Yes. Traders can modify the moving average period, method, and applied price to adapt the indicator to different trading styles.
Is this indicator suitable for all timeframes?
It is designed for scalping, so lower timeframes are preferred. It can work on higher timeframes, but signals will appear less frequently.
Summary
The Directional Breakout indicator provides a simple way to scalp the Forex market with colored histogram signals.
Green and red bars highlight bullish and bearish trends, while yellow bars warn of neutral periods.
By focusing on the first appearance of green or red bars, traders can enter trades with a clear directional bias.
Its non-repainting design ensures that signals remain reliable, offering traders confidence when executing rapid entries and exits for scalping opportunities.





