
About the Daily Open Line Indicator
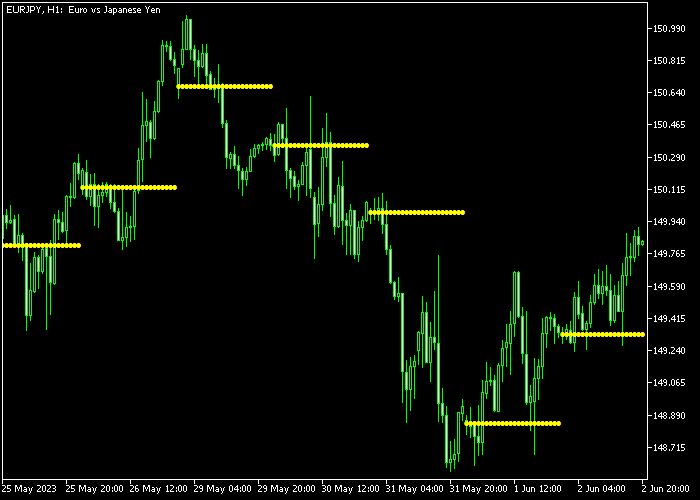
The Daily Open Line Indicator for MT5 plots the daily open price as a yellow line on the price chart, giving traders an immediate view of market direction over several days.
By comparing the current day’s open with previous days, traders can quickly gauge whether the market trend is upward or downward.
If the current day’s open price is above the previous day’s open, it signals a potential upward trend.
If it is below, it indicates a potential downward trend.
The indicator is customizable, allowing users to adjust the hour of the daily open and the line style to suit their charting preferences.
Free Download
Daily_Open_Line.mq5 Indicator (MT5)
Key Features
- Plots daily open prices over multiple days as a yellow line on the chart.
- Helps identify short-term market trends at a glance.
- Customizable daily open hours and line style.
- Provides context for other indicators and strategies, enhancing decision-making.
Indicator Chart
The Daily Open Line Indicator displays a yellow horizontal line for each day’s open price beneath the main chart area.
Traders can quickly see if the market is trending up or down by comparing the current daily open to previous opens.
This provides visual guidance for trend-based entries when combined with other tools.

Guide to Trade with the Daily Open Line Indicator
Buy Rules
- Identify that the current day’s open is higher than the previous day’s open.
- Confirm overall bullish price action or use a supporting indicator to validate the trend.
- Enter a buy position in alignment with the upward trend.
- Focus on trades where the price respects the daily open line as support.
Sell Rules
- Identify that the current day’s open is lower than the previous day’s open.
- Confirm overall bearish price action or use a supporting indicator to validate the trend.
- Enter a sell position in alignment with the downward trend.
- Focus on trades where the price respects the daily open line as resistance.
Stop Loss
- For buy trades, place a stop below the previous day’s open or nearest support level.
- For sell trades, place a stop above the previous day’s open or nearest resistance level.
- Use the daily open line to help identify logical buffer levels for protection.
Take Profit
- Close buy positions if the daily open line of a new day forms below the entry price or an opposite signal from your other indicators appears.
- Close sell positions if the daily open line of a new day forms above the entry price or an opposite signal from your other indicators appears.
- Partial profits can be taken near previous support/resistance levels aligned with the daily open lines.
- Optionally trail positions in the direction of the trend while respecting daily open levels.
Daily Open Line MT5 Strategy with Super Arrow Confirmation
This strategy combines the Daily Open Line Forex Indicator with the Super Arrow Buy Sell Indicator to create a clean scalping method based on daily bias and precise entry signals.
The Daily Open Line determines the overall market direction by comparing today’s open to the previous day’s close.
When the current day’s open is higher than the previous day’s open, it shows bullish pressure.
When it is lower, it indicates bearish pressure.
The Super Arrow indicator provides exact entry timing using visual arrows.
Blue arrows signal potential buy trades, while red arrows indicate sell opportunities.
Combining these two tools allows you to trade in the direction of the daily bias while entering at precise moments.
This approach works best on M1 and M5 timeframes.
It fits scalpers and day traders who want quick trades aligned with the broader daily movement.
Buy Entry Rules
- Confirm that the current day’s open is higher than the previous day’s open.
- Wait for a blue arrow from the Super Arrow indicator.
- Enter a buy trade at the close of the arrow candle.
- Place the stop loss below the recent swing low.
- Take profit when a red arrow appears or at a nearby resistance level.
Sell Entry Rules
- Confirm that the current day’s open is lower than the previous day’s open.
- Wait for a red arrow from the Super Arrow indicator.
- Enter a sell trade at the close of the arrow candle.
- Place the stop loss above the recent swing high.
- Take profit when a blue arrow appears or at a nearby support level.
Case Study 1: Buy Trade Example (EUR/USD M5)
The current day’s open was higher than the previous day’s open, confirming a bullish bias.
A blue arrow appeared on the chart, signaling a buy opportunity.
A buy trade was opened at the candle close with the stop loss placed below the recent swing low.
Price moved upward for a short period before slowing down, and the position was closed when a red arrow appeared, marking the end of the setup.
Case Study 2: Sell Trade Example (GBP/USD M1)
The current day’s open was lower than the previous day’s open, confirming a bearish bias.
A red arrow appeared, signaling a sell opportunity.
A sell trade was opened at the candle close with the stop loss placed above the recent swing high.
Price moved downward with brief pullbacks, and the position was closed when a blue arrow appeared, indicating a shift in short-term direction.
Download Now
Daily_Open_Line.mq5 Indicator (MT5)
FAQ
How does the Daily Open Line help identify trends?
By comparing the current day’s open to the previous day’s open, traders can see if the market is trending upward or downward and plan entries accordingly.
Can it be used for trading on M5 or M15 charts?
Yes, the daily open line can provide context for short-term trades, helping scalpers and day traders align entries with the daily trend.
Does the indicator generate buy or sell signals?
No, it does not provide direct trading signals. It is designed to be used alongside other indicators or trading strategies.
Can I customize the daily open line?
Yes, you can adjust the hour for the daily open and modify the line style to fit your charting preferences.
Summary
The Daily Open Line Indicator helps traders visualize market trends by plotting daily open prices.
While it doesn’t provide direct buy or sell signals, it is an effective tool to gauge overall market direction and identify support and resistance levels for trend-aligned trades.
When combined with other indicators or strategies, it can improve entry timing, guide stop placement, and help traders maintain a disciplined approach based on daily trend structure.





