
About the Doji Pattern Indicator
The Doji Pattern Indicator for MT5 scans currency pairs to identify Doji candlestick formations and plots them directly on the price chart.
A Doji occurs when the opening and closing prices are nearly equal, signaling indecision between buyers and sellers in the market.
This indicator is based purely on price action, so it reacts instantly to the latest market data without lag.
Traders use Doji formations to anticipate potential trend reversals or pauses in momentum, often confirming them with other technical tools.
The indicator includes customizable settings for colors and style, allowing traders to highlight patterns in a way that is visually clear and matches their chart preferences.
While the Doji Pattern indicator can be used on its own, combining it with trend analysis, support and resistance levels, or oscillators can improve trade accuracy.
Free Download
Doji_Arrows.mq5 Indicator (MT5)
Key Features
- Detects Doji candlestick formations on any currency pair.
- Plots detected Doji patterns directly on the price chart.
- Price action based with no lag.
- Customizable colors and style for easy identification.
- Can be used alongside other technical tools for confirmation.
- Helps anticipate potential trend reversals or pauses.
- Simple and fast way to identify market indecision points.
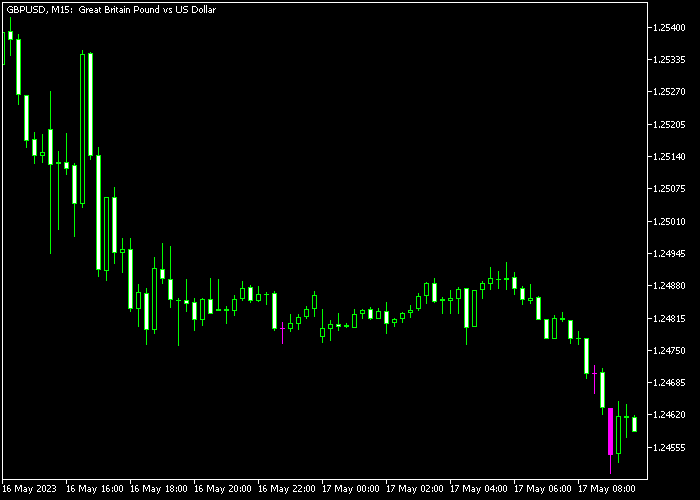
Indicator Chart
The Doji Pattern Indicator appears directly on the price chart and highlights Doji candlestick formations.
Traders can quickly see where market indecision occurs.
These Doji candles often signal potential reversals or pauses in the trend and can be combined with other indicators for more reliable entries.

Guide to Trade with the Doji Pattern Indicator
Buy Rules
- Wait for a Doji formation at or near a support level.
- Confirm a bullish trend or reversal signal with other indicators.
- Open a buy position once the following candle confirms upward movement.
- Hold the trade while momentum remains bullish.
Sell Rules
- Wait for a Doji formation at or near a resistance level.
- Confirm a bearish trend or reversal signal with other indicators.
- Open a sell position once the following candle confirms downward movement.
- Stay in the trade while momentum remains bearish.
Stop Loss
- Place the stop loss slightly below the Doji low for buy trades.
- Place the stop loss slightly above the Doji high for sell trades.
- Maintain proper risk management with consistent position sizing.
Take Profit
- Close buy trades when a bearish candlestick pattern appears after the Doji.
- Close sell trades when a bullish candlestick pattern appears after the Doji.
- Secure profits if the market shows signs of trend exhaustion.
Doji Pattern Trend Reversal Strategy for MT5
This strategy combines the Doji Pattern Indicator with the Multi Time Frames Support Resistance Indicator to capture high-probability reversal setups.
The idea is simple. Doji candles reflect market indecision.
When that indecision appears at strong support or resistance zones, it often signals a shift in control between buyers and sellers.
By aligning Doji formations with higher time frame levels, you filter out weak signals and focus only on meaningful turning points.
This approach works well on M15, M30, and H1 timeframes.
It fits traders who prefer clean price action while still relying on clear support and resistance zones.
Buy Entry Rules
- Wait for price to approach or touch a red support level from the Multi Time Frames Support Resistance Indicator.
- Look for a Doji candle formed at or very close to that support zone.
- Enter a buy trade after the next bullish candle confirms upward momentum.
- Place a stop loss below the recent swing low or slightly under the support level.
- Take profit when price reaches the next resistance level or when bearish candles begin to appear.
Sell Entry Rules
- Wait for price to reach a green resistance level from the Multi Time Frames Support Resistance Indicator.
- Identify a Doji candle forming at or near that resistance zone.
- Enter a sell trade after a bearish confirmation candle closes.
- Place the stop loss above the recent swing high or just above the resistance level.
- Take profit at the next support level or when bullish pressure starts to build.
Case Study 1: EURUSD M15 Bullish Reversal from Support
On the EURUSD M15 timeframe, price was in a broader bullish trend but pulled back toward a red support level drawn by the Multi Time Frames Support Resistance Indicator.
As price touched this level, a Doji candle formed, showing that selling pressure was weakening.
The following candle closed bullish, confirming that buyers had regained control.
A buy trade was opened at the close of this confirmation candle.
The stop loss was placed just below the recent swing low and slightly under the support line.
Price then moved upward in line with the overall trend.
The trade was closed near the next green resistance level, capturing a clean reversal move from support.
Case Study 2: GBPUSD H1 Bearish Reversal from Resistance
On the GBPUSD H1 timeframe, price had been trending upward and reached a strong green resistance level identified by the Multi Time Frames Support Resistance Indicator.
At this level, a Doji candle appeared, signaling hesitation from buyers.
The next candle closed bearish, confirming rejection from the resistance zone.
A sell trade was entered after this confirmation.
The stop loss was placed just above the resistance level and recent high.
Price then reversed downward and created a steady bearish move.
The position was closed near the next red support level as buying pressure began to return.
Download Now
Doji_Arrows.mq5 Indicator (MT5)
FAQ
What is a Doji candlestick?
A Doji candlestick forms when the opening and closing prices are nearly equal.
It reflects market indecision between buyers and sellers and can signal potential trend reversals or pauses.
Can the indicator be used alone?
While it can detect Doji formations on its own, combining it with trend analysis, support and resistance levels, or other indicators improves the accuracy of trade entries.
Which parameters can be adjusted?
You can customize the colors and style of the Doji markings on the chart to match your preferences and make patterns easier to spot.
Summary
The Doji Pattern Indicator provides a fast and efficient way to identify Doji candlestick formations directly on the price chart.
These formations highlight moments of market indecision, helping traders anticipate potential trend reversals or pauses.
By combining the Doji signals with other technical tools such as support and resistance levels, moving averages, or oscillators, traders can improve trade timing and accuracy.
Customizable colors and styles allow for easy visualization of patterns on any chart.
Overall, this indicator is a practical tool for traders who want to enhance price action analysis and make informed trading decisions using clear candlestick signals.





